Monitor edge infrastructure and applications
The purpose of this document is to answer the question:
How do I monitor my edge infrastructure and applications?
We describe two monitoring perspectives:
- Site provider: you own and manage the infrastructure, edge sites and hosts
- Application owner: you manage the life-cycle of the applications
When you read this instruction you might want to dig into more details on the various metrics.
Monitoring Overview
Monitoring your edge infrastructure and applications is crucial for ensuring optimal performance and reliability. Avassa provides various tools and techniques to help you gain insights into your system's behavior and health.
At the highest level you can use the dashboard, the application and site views to get a quick overview of the health of your infrastructure and applications. From there you can drill down into more detailed views and logs.
The dashboard is illustrated below:
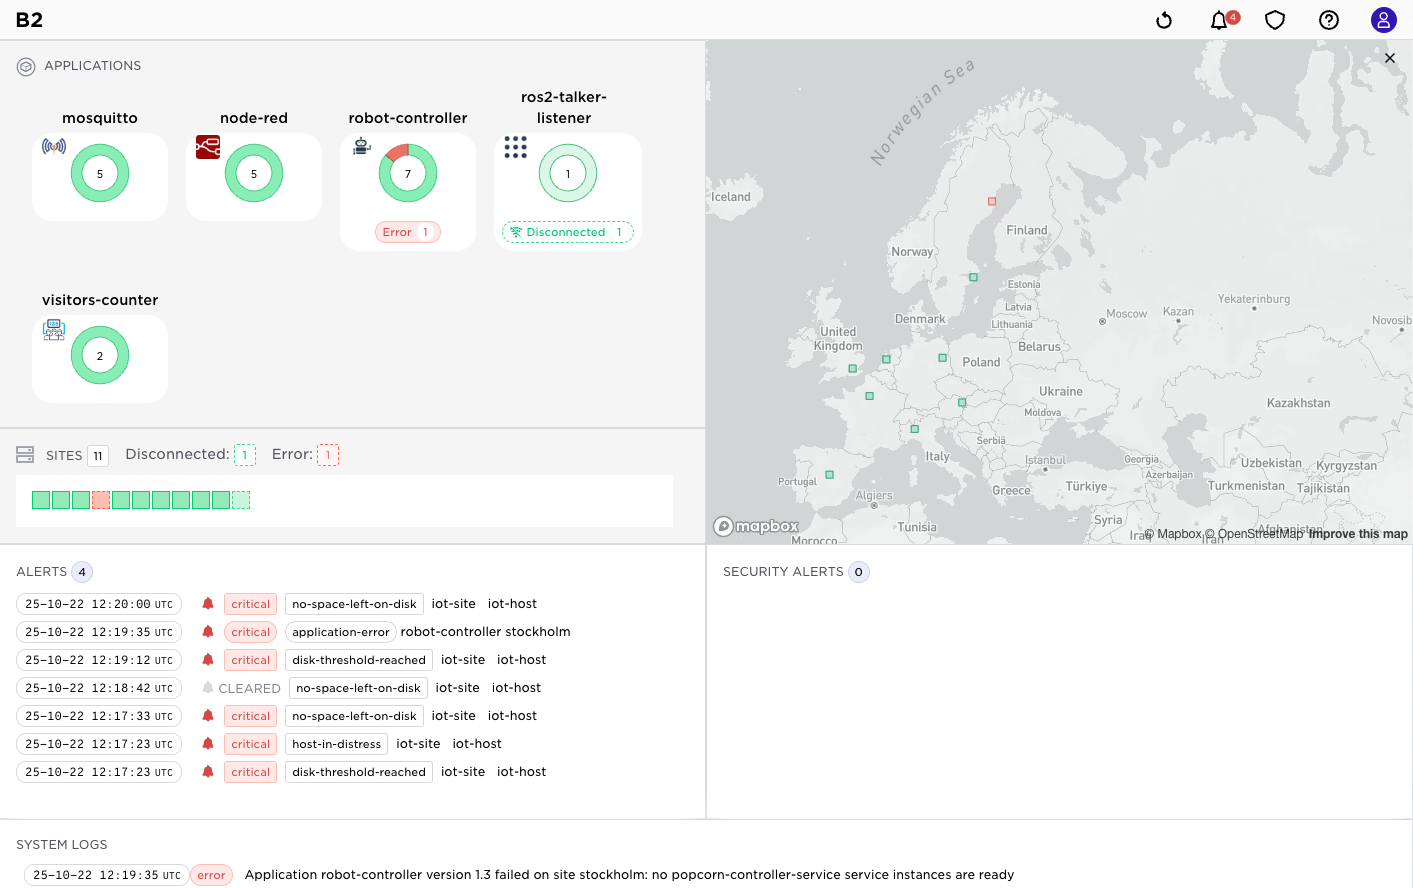
At the top you will see the state of your applications such as ongoing deployments, nunmber of failed applications across sites etc. It also gives a heat map of your sites.
Latest alerts and important system logs are displayed at the bottom of the dashboard.
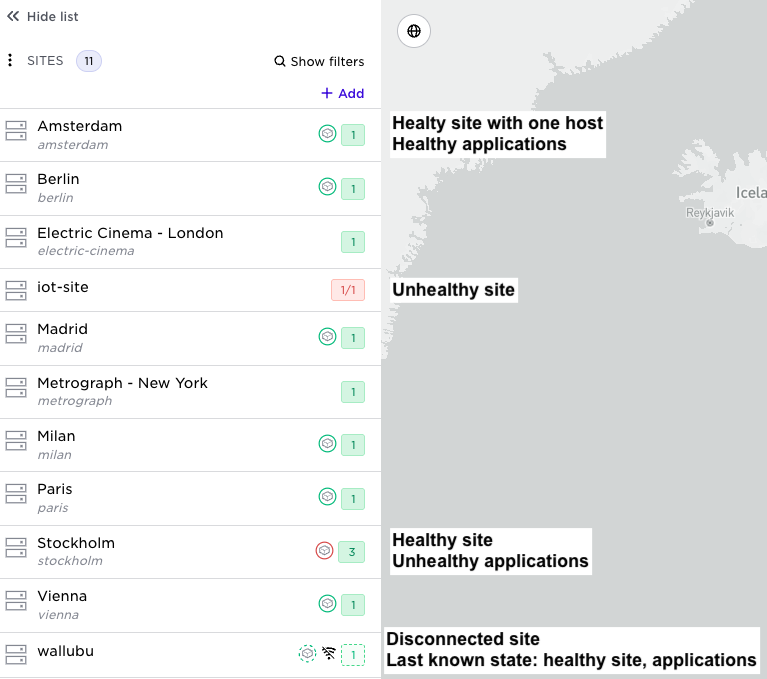
Moving over to the site list you will see the state of your sites, hosts, applications per site etc. You can drill down into each site to see more details.
Similarly, you can view the applications list to see the state of your applications across sites.
Basics
There are three primary sources for your monitoring activities:
- React on alerts, special topics in Volga are alerts that all represents undesirable states that should require action
- Subscribe to telemetry data available as topics on the built-in pub/sub bus Volga.
- Inspect the state of objects
It is essential to understand that different states and topics live in the central Control Tower and the sites respectively. On the sites, you have the site's most real-time, up-to-date state and site local telemetry. In general, most telemetry stays on the site and is not automatically pushed to Control Tower. Some coarse-grained state is propagated to Control Tower.
Note well also that sites might be disconnected. Control Tower has the latest known state for the sites.
Volga topics live at the sites and Control Tower respectively: some topics
- ...exist at both but with different content; for example system:logs
- ...are exclusive to Control Tower: example system:events
- ...are exclusive to the site: example system:host-metrics and the container logs
- ...are propagated to the Control Tower: example system:site-alerts
To learn this:
Topics in Control Tower:
supctl list volga topics
- system:alerts
- system:all-scheduler-events
...
Topics on a site:
supctl list --site amsterdam volga topics
- system:alerts
- system:all-scheduler-events
...
The same pattern holds for inspecting state. To get the details on an application you would have to read from the site, whereas you have a more coarse-grained latest state always available in Control Tower:
supctl show applications popcorn
name: popcorn
version: "2.0"
services:
  - name: popcorn-service
    mode: replicated
    replicas: 1
    containers:
...
While on the site you will see detailed run-time state:
supctl show --site amsterdam applications popcorn
name: popcorn
version: "2.0"
services:
  - name: popcorn-service
 ...as above
 ...
service-instances:
  - name: popcorn-service-1
    application-version: "2.0"
    oper-status: running
    ready: true
    host: amsterdam-001
    application-network:
      ips:
        - 172.29.0.1/16
      dns-records:
        - popcorn-service-1.popcorn.internal. 15 IN A 172.29.0.1
        - popcorn-service.popcorn.internal. 15 IN A 172.29.0.1
    gateway-network:
      ips:
        - 172.28.255.2/24
    ingress:
      ips: []
    containers:
      - name: popcontainer
        id: 54adc135bd9f
        oper-status: running
        ready: true
        start-time: 2023-02-01T11:08:37.650Z
        current-restarts: 0
        total-restarts: 0
        probes:
          startup:
            status: success
          readiness:
            status: success
          liveness:
            status: success
As you see in the above command, you have runtime information about the service instances on the site.
Please refer to the Volga reference guide for more information on each topic. To read more on the attributes of the objects, see our REST API reference guide. Also note that topics are tenant-specific. For example, an application owner does not see topics related to the infrastructure. The purpose of this document is to give overall guidance on which topics and states are helpful for which purpose.
To perform monitoring activities, the Avassa Control Tower contains the functions you need for manual work. All functions described here are also available over APIs so that you can integrate and automate the activities in your overall monitoring solution.
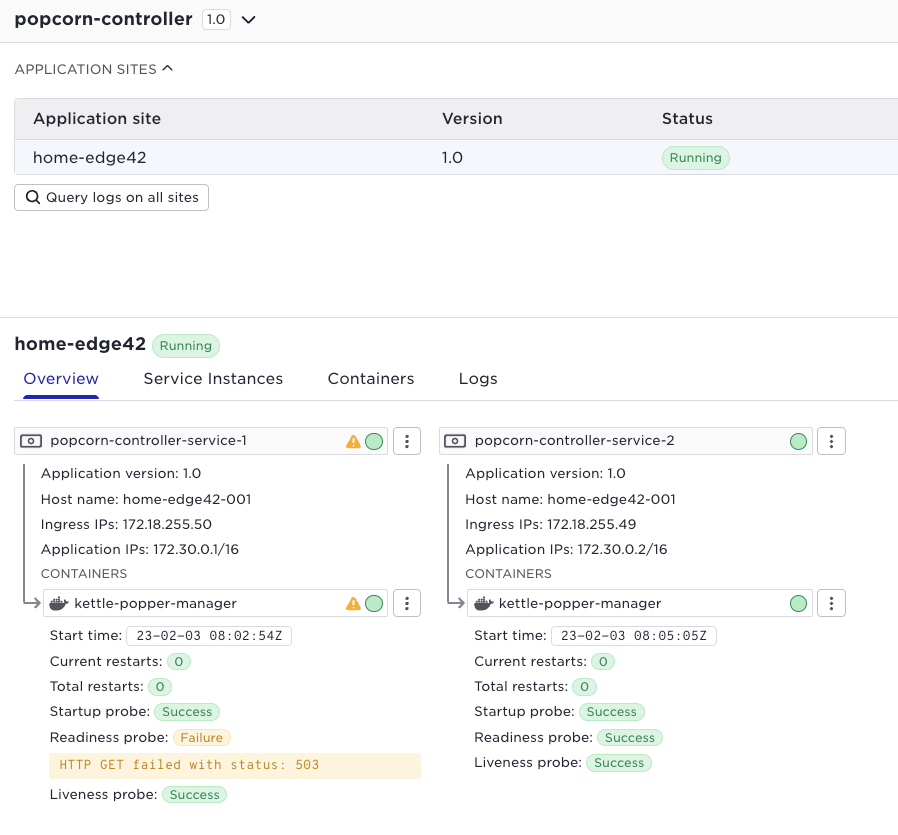
When it comes to state, Avassa interprets the state using contextual information. How severe is the state of an object? That depends on context. For example, if a container fails within the only service instance of an application the application will fail as well and raise an application alert. However if the application runs two service replicas and the container fails only in one of them, the application will not fail. See illustrations below:
Single replica fails:
2 replicas, one failing:
Alert topics send discrete events for alert raise and alert clear. The latest alert raise are available in the clock ikon:
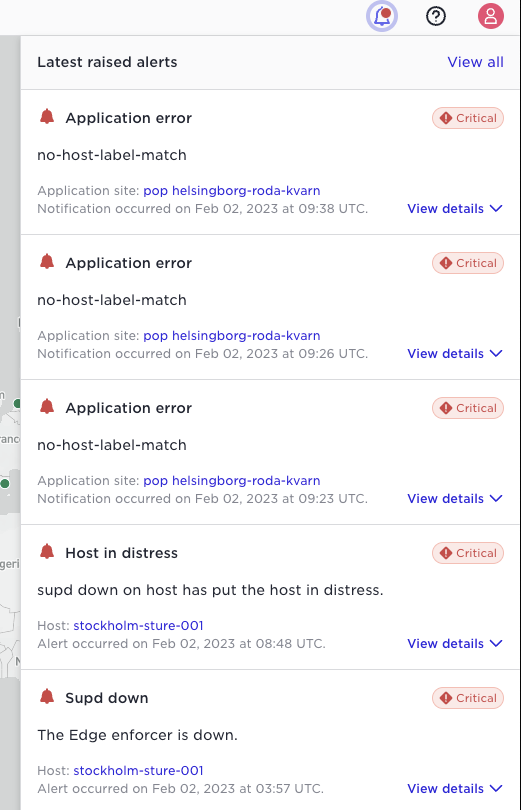
You can use the "View all" link or the "Alerts" menu item in the left menu bar to see and search all alerts.
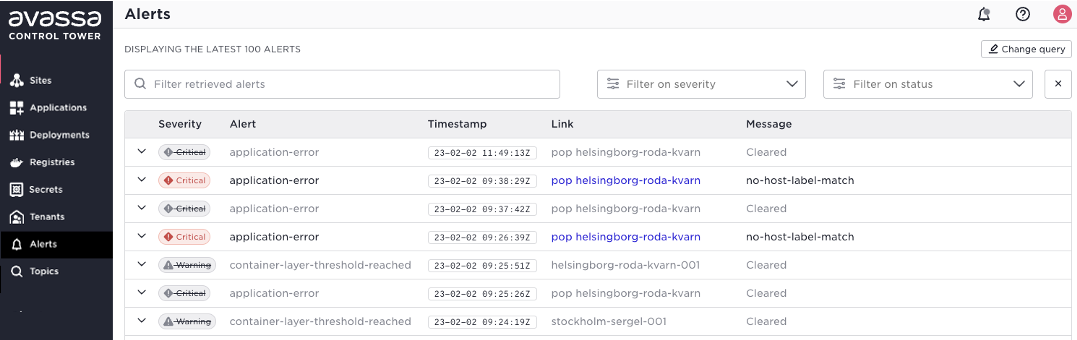
Note: the Avassa system does not currently correlate clear and raise, these are shown as individual events in time order. Furthermore, when the Edge Enforcer restarts it sends clear alerts for all states.
Infrastructure monitoring
If you are a site provider, you need to monitor the health of the infrastructure, which corresponds to sites and hosts in Avassa.
We have the notion of hosts in distress, meaning that we consider hosts unhealthy. A host can enter this state for several reasons, such as disc space issues. By providing built-in heuristics for these states we simplify the boot-strapping of your monitoring solution. If any hosts on a site is in distress the site will be marked red in the Control Tower UI as an indication that you should drill down. Alerts will also be generated so that you will be notified even if you are not focusing on the "right place" in the UI.
There might sometimes be a blame-game between infrastructure teams and application teams. Therefore we provide linkage from the infrastructure to the running applications (service impact) and vice versa (root cause).
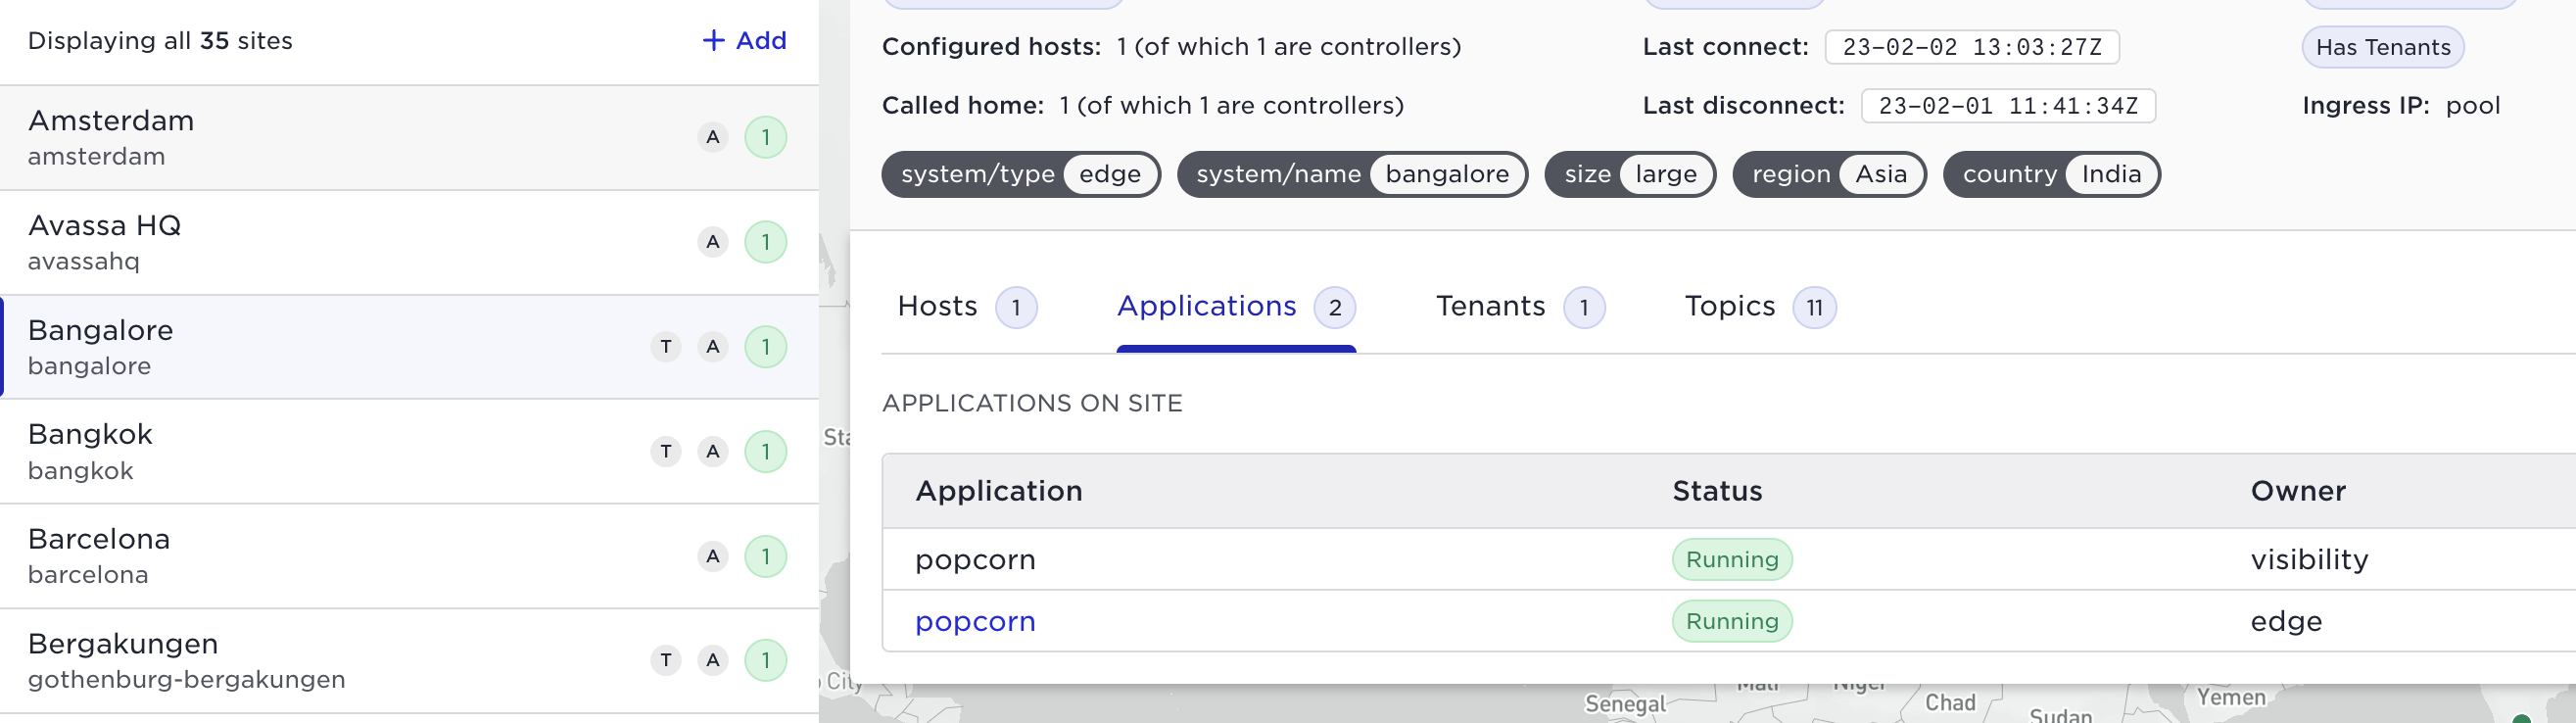
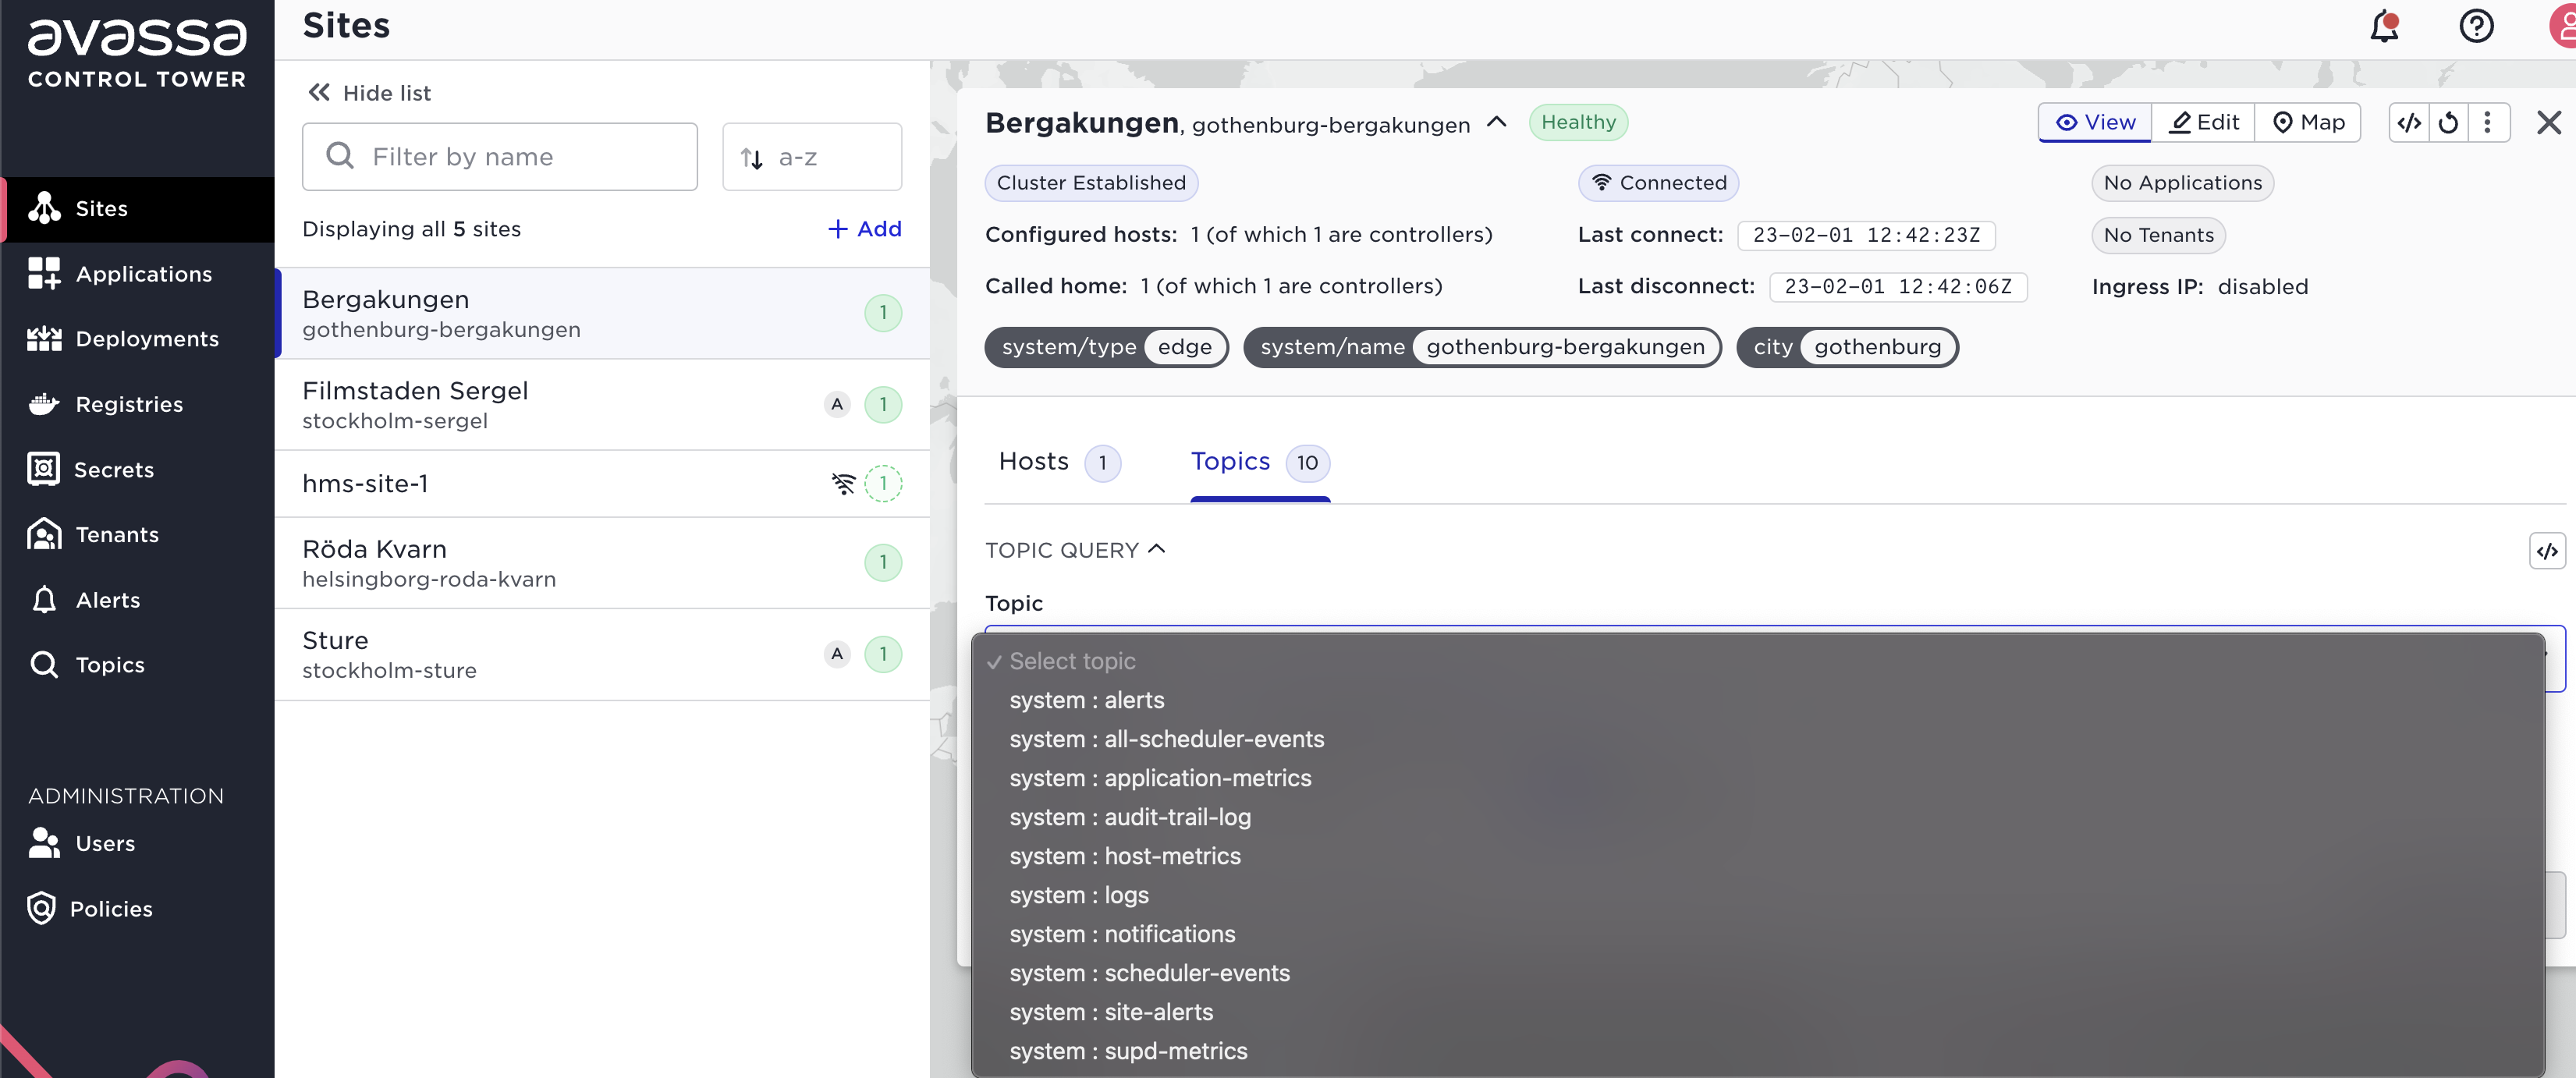
As an infrastructure owner you can see which applications and tenants exist on a site. In the Web UI to the left for each site you will see: how many hosts, (number within the circle)? any hosts in distress (red circle), an (A) indicates running applications, and a (T) indicates tenants on the site. This will guide your operational priorities, an issue on a site without running applications is less severe than a site with tenants and/or applications. If you select a site you are able to see which applications and tenants exist on the site. The same information is available over APIs. Detail further down in this document.
Control Tower topics
The easiest way to get examples from your live system is to use the topic search in the Control Tower. Click the topics icon to the left:
Perform a search there and learn the payload from your system.
You can also use supctl, for example:
supctl do volga topics system:alerts consume
See the tutorial on supctl and Volga tutorial for more examples.
The table below lists and summarizes relevant topics for infrastructure monitoring.
| Topic | Description |
|---|---|
| system:alerts | These are alerts related to applications like issues with ephemeral storage or operational state on the application. |
| system:site-alerts | Alerts related to site infrastructure, such as disc usage on a host. It would be best if you reacted on any alerts published here. |
| system:events | Notifications regarding hosts connecting/disconnecting. A site disconnecting might not be critical as such, but essential to be aware of it. No events will be pushed to the Control Tower during the disconnected state. You might want to trouble-shoot why the site is not connected. |
| system:logs | It is a good practice to monitor for EMERGENCY , ALERT, CRITICAL ERROR, and WARNING. This will mostly be related to the Avassa platform in the Control Tower. In combination with the site-alerts above, log entries with high severity in this topic are good candidates for integration into an alarm system. |
| system:config-events | This contains events about objects being created, updated, and deleted. So, for example, if you want to monitor sites being created, you can monitor this topic. |
| system:audit-trail-log | This is a full audit trail log of operations performed over APIs, supctl, and the Web UI. This is useful for integration into an overall audit trail system. This topic is a union of all sites' audit trail logs. This to have audit information even if the site is disconnected. |
| system:unauthenticated-audit-trail-log | Some operations are not authenticated such as the login, these events are posted here. |
An overall recommendation would be as follows:
- Integrate
system:alerts,system:site-alertsandsystem:logs(subset of severity levels) to an alerting system - Define your procedure for treating disconnected sites and integrate connection events accordingly.
- The
system:config-eventscan be integrated to your inventory/CMDB system to keep an updated view on your edge artifacts. - Integrate the audit trail log topics to your overall audit trail system
Site topics
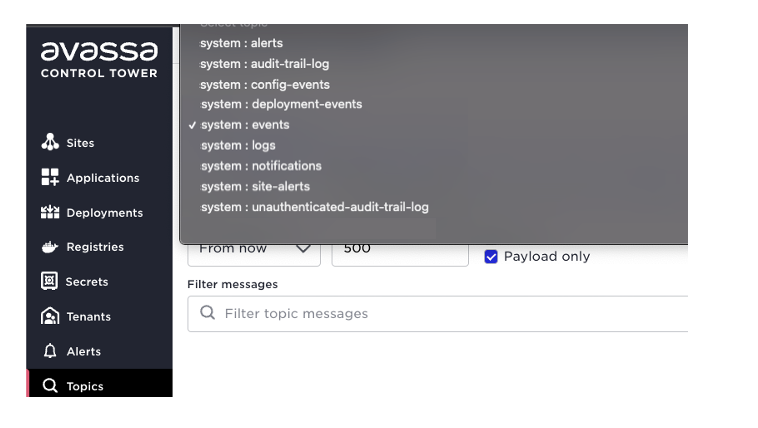
The easiest way to get examples from your live system is to use the topic search function on a site. Click sites, pick a site, and go to the topics tab:
Perform a search there and learn the payload from your system.
You can also use subctl:
supctl do --site gothenburg-bergakungen volga topics system:host-metrics consume
| Topic | Description |
|---|---|
| system:site-alerts | This is the basis for your infrastructure monitoring per site. These are as well propagated to the Control Tower |
| system:host-metrics | This is a highly relevant topic for monitoring your sites. Every 30 seconds various metrics for the host regarding for example disc, memory, load etc is published |
| system:logs | It is a good practice to monitor for EMERGENCY , ALERT, CRITICAL,ERROR and WARNING. Entries might refer to the infrastructure as well as applications depending on your tenant. |
A simple recommendation is to integrate system:logs (a subset if severity levels) and system:site-alerts into an overall alerting system. The system:host-metrics should be integrated to a time-series analytics solution with thresholding and anomaly detection.
State, drill down
Many state changes for objects will result in events on the above mentioned topics. But both as a drill-down action of an event and as an active pull, we list a number of read requests that makes sense from a monitoring perspective.
State in Control Tower, latest reported from the site. (If you run the commands with option - verbose you will see the path that can be used in a REST call).
supctl show system site-status sites
This will list all sites and a summary of their status
name: amsterdam
type: edge
descriptive-name: Amsterdam
hosts: 1
hosts-called-home: 1
hosts-in-distress: 0
cluster-established: true
connection-state:
connected: true
last-connect: 2023-02-02T12:58:21.520Z
last-disconnect: 2023-02-01T11:41:42.770Z
location:
latitude: 52.37713501238853
longitude: 4.895028823252919
tenants: 0
deployed-applications: true

name: avassahq
...
supctl show system sites amsterdam
This will give you details about the sites and hosts on the site such as connection information, host volumes, host interfaces, Edge Enforcer (container supd) version etc.
name: bangalore
descriptive-name: Bangalore
type: edge
location:
  latitude: 13.2678728306991
  longitude: 77.53790818278752
creation-time: 2023-02-01T09:11:27.122Z
domain: bangalore.wallan.edge.avassa.dev
labels:
  system/type: edge
  system/name: bangalore
  size: large
  region: Asia
  country: India
topology:
  parent-site: control-tower
ingress-allocation-method: pool
connection-state:
  connected: true
  last-connect: 2023-02-02T15:09:30.546Z
  last-disconnect: 2023-02-01T11:41:34.722Z
call-home-state:
  all-hosts:
    called-home: 1
    total: 1
  controller-hosts:
    called-home: 1
    total: 1
  cluster-established: true
hosts:
  - host-id: c3f06066-e095-641f-027e-2214a28c1f2c
    controller: true
    local-volumes:
      - name: volume1
        path: /xfs
    network-interfaces:
      - name: default
        host-interface-by-default-route: true
        ingress-ipv4-address-ranges:
          - range: 172.31.21.108
            network-prefix-length: 20
          - range: 172.31.22.92
            network-prefix-length: 20
    cluster-hostname: bangalore-001
    hostname: hugely-assuring-quail
    supd-version: 23.2.0-27467d86
    last-call-home:
      time: 2023-02-01T11:41:45Z
      reason: startup
    smbios:
      board-asset-tag: i-0f373feda10d171a3
      board-vendor: Amazon EC2
      chassis-asset-tag: Amazon EC2
      chassis-type: "1"
      chassis-vendor: Amazon EC2
      product-name: t3.small
      product-serial: ec23a594-2bf7-135d-8110-adcaf1243f30
      product-uuid: ec23a594-2bf7-135d-8110-adcaf1243f30
    platform:
      architecture: x86_64
      total-memory: 1994064 KiB
      vcpus: 2
      operating-system: Debian GNU/Linux 11 (bullseye)
      kernel-version: 5.10.0-21-cloud-amd64
      docker:
        version: 20.10.23
        api-version: "1.41"
        os: linux
        arch: amd64
        git-commit: 6051f14
        components:
          - name: Engine
            version: 20.10.23
          - name: containerd
            version: 1.6.16
          - name: runc
            version: 1.1.4
          - name: docker-init
            version: 0.19.0
supctl show system sites bangalore allocations
This will give you a list of tenants and their respective applications on the site.
tenants:
  - name: tenant1
    applications:
      - name: popcorn
To get a summary of applications that you have running on a site and respective status. More on application monitoring in next subsection. This is to show that if you are responsible for the infrastructure you can easily get information on which applications are running on a site.
supctl --tabular show --site amsterdam applications --fields name,version,oper-status
name      version   oper-status
-------   -------   -----------
popcorn   2.0       running
If you are responsible for the hosts it is also important to see which services are running on a host, if any. For example imagine you would like to upgrade the OS and wait until no services are running there you can do:
supctl show --site amsterdam system cluster service-instances
- name: edge.popcorn.popcorn-service-1
  tenant: edge
  application: popcorn
  application-version: "2.0"
  oper-status: running
  ....
Other relevant infrastructure monitoring states are related to the call home process.
supctl show system call-home <TAB>
duplicates
unclaimed
This would list duplicate host ids calling home, this might just be a human error but might also a security issue, someone trying to reuse a host id. The unclaimed hosts list will show hosts calling home without any matching host id in a site.
To get even more details on a host you can read the host state from the site:
supctl show --site amsterdam system cluster hosts
- cluster-hostname: amsterdam-001
  version: 23.2.0-27467d86
  oper-status: up
  maintenance-mode: off
  hostname: reasonably-famous-kitten
  host-id: dec622a5-376b-769e-1481-428503b3b06d
  controller: true
  labels:
    system/controller: "true"
  device-labels: {}
  devices: []
  local-volumes:
    - name: volume1
      status: up
      filesystem:
        type: xfs
        size-limit-support: true
      is-mountpoint: true
      space:
        total: 1014 MiB
        allocated: 0 B
        free: 1014 MiB
  host-network:
    ip-addresses:
      - 172.31.22.155
      - fe80::412:f0ff:fe77:5804
  site-overlay-network:
    status: up
    ip-addresses:
      - 172.30.0.1
  network-interfaces:
    - name: default
      os-interface-name: ens5
      ingress-ipv4-address-allocation:
        summary:
          unallocated: 2
          allocated: 0
        unallocated:
          ranges:
            - 172.31.20.181
            - 172.31.26.133
        active-pool: interface-specific
Apart from the state related to the host such as volumes and networking it is worth-while pointing out to states:
- oper-status: from an Avassa Edge perspective do we consider the host up or in distress
- maintenance-mode: there are maintenance actions like blocking and draining a host in order to perform maintenance such as OS upgrades.
offindicates normal operation, other states can beblockedordrain.
Avassa is capable of discovering udev devices, for example cameras, and use that for application scheduling. You can read the devices from a host by issuing:
supctl do --site amsterdam system cluster hosts amsterdam-001 get-udevs
Application monitoring
We strongly recommend that you define application probes for your containers. This will give you a much better insight into the health of your applications rather than just inspecting the container state. Many issues are related to response times, not total failures, that is where application probes will help you. Not just does it give an application level monitoring it also provides that per sight. A certain site might suffer from application response times whereas others not.
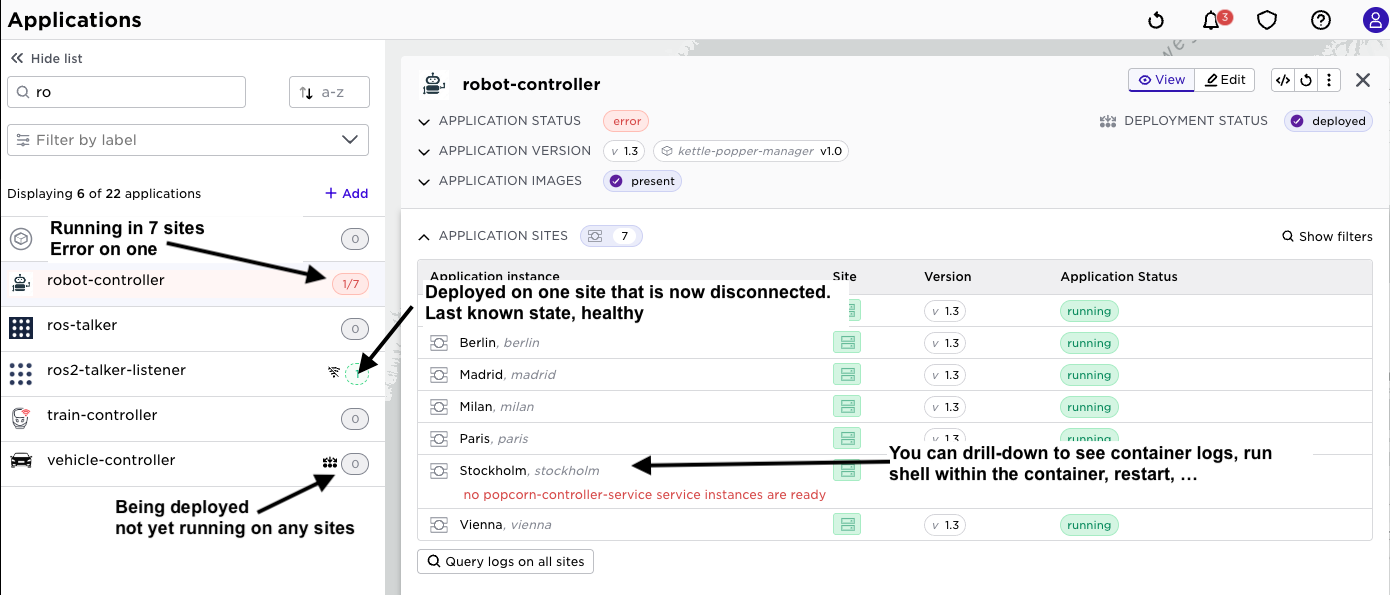
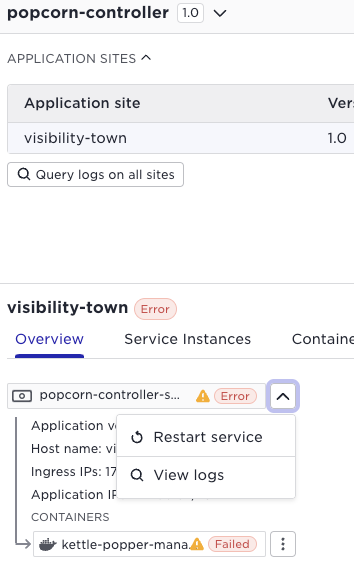
In order to inspect the application health at a site in the UI, pick the application and thereafter the specific site:
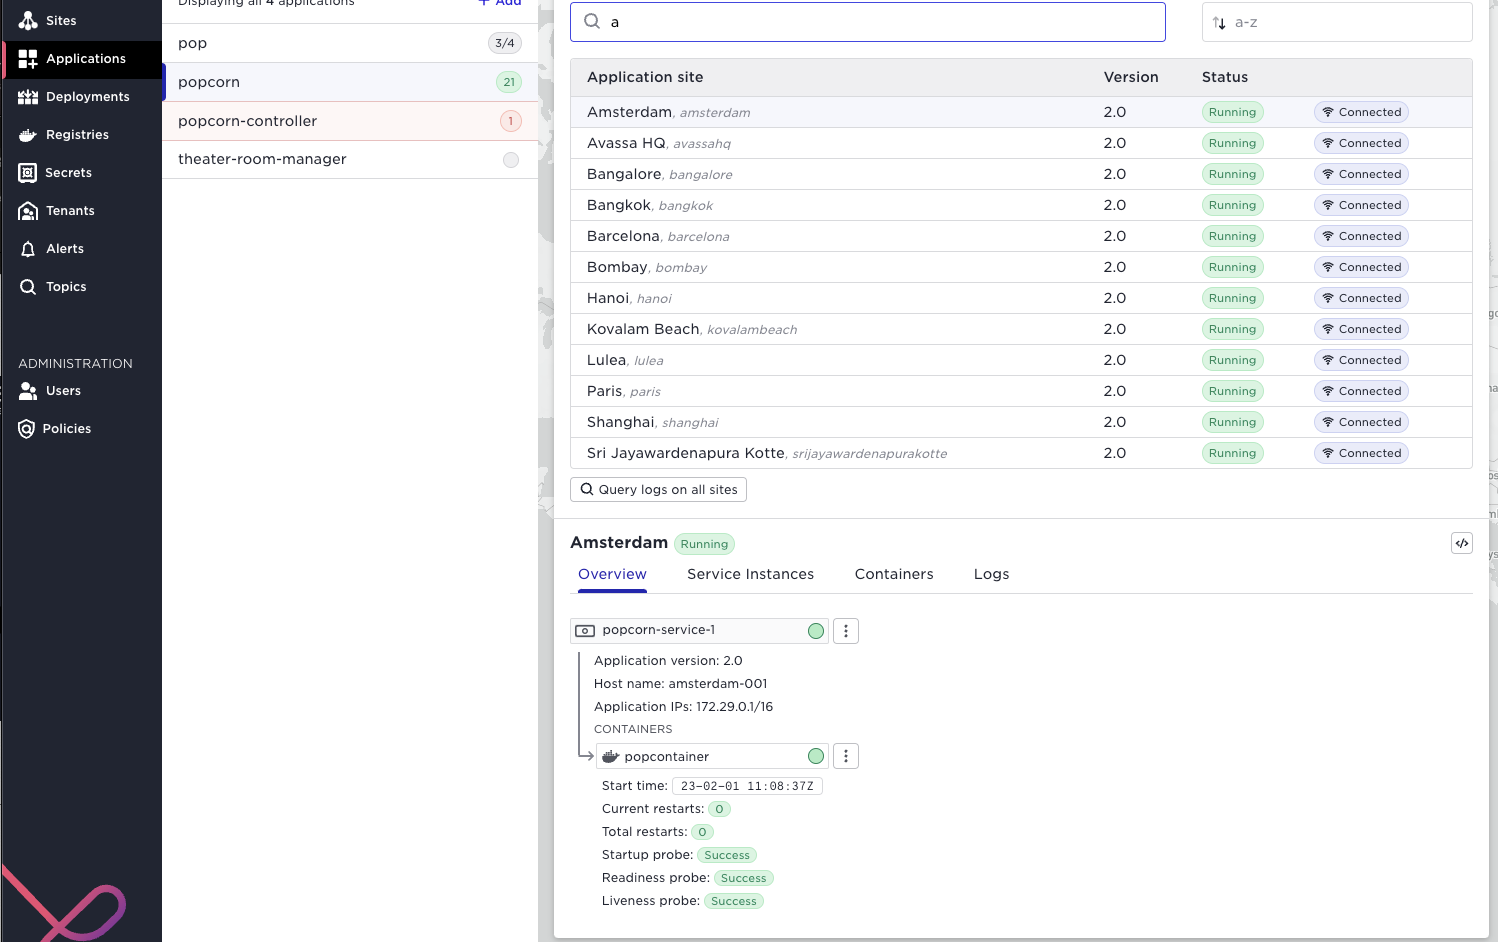
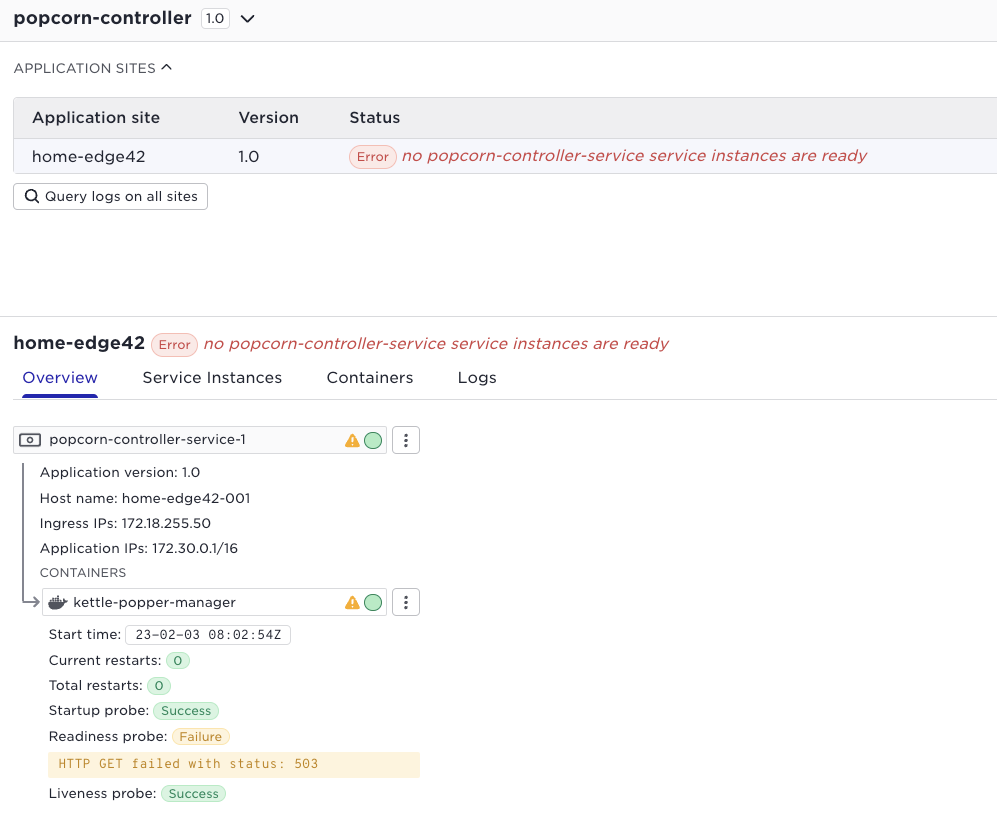
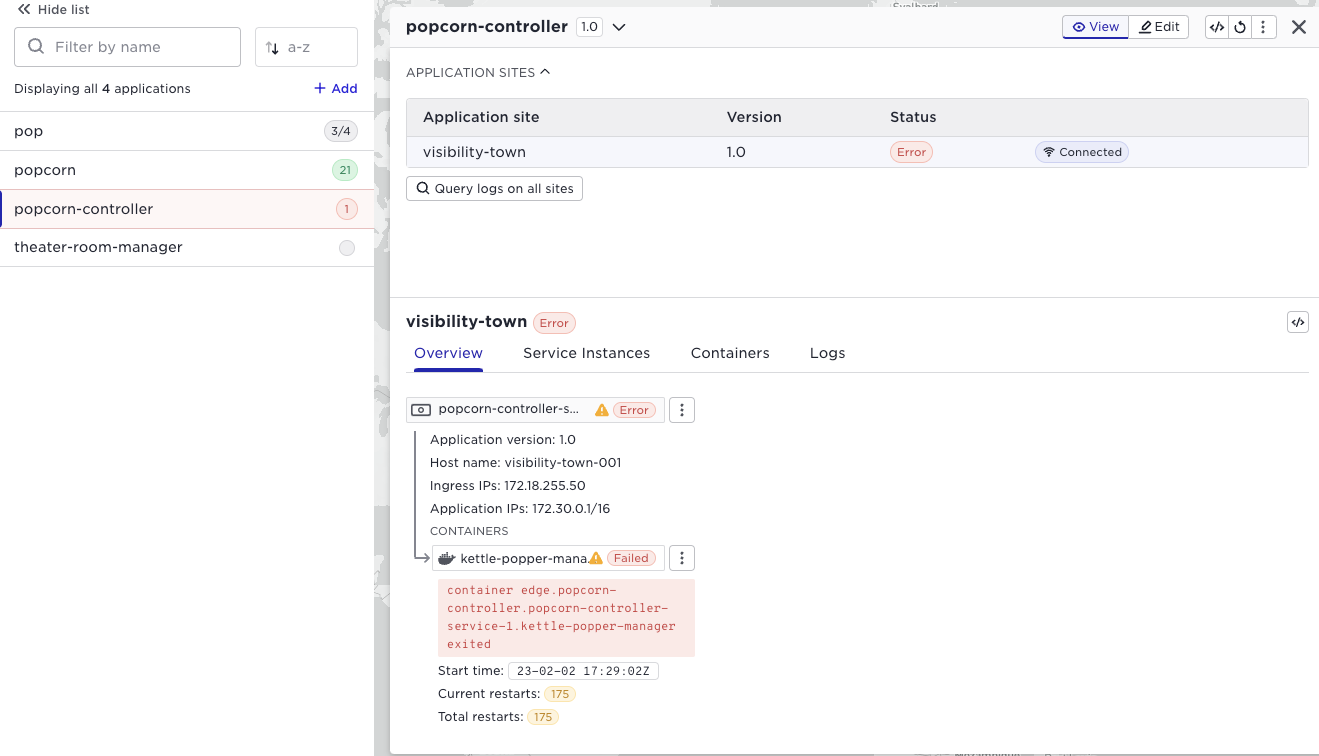
Note well the context state propagation, a failure of a container might propagate an error to the service - to the application running on the site and all the way to the application in the application list to the left. Say you have the popcorn application running at 21 sites, (as above), and it would fail on two sites, the popcorn application would be red and the number of failed applications indicated. You can drill down all the way to the failing container like in the screen shot below;
At this stage you would probably do a number of actions in the Avassa system
- inspect the container logs: issue within the container logic?
- inspect the
system:logstopic: issue outside the container logic?
More on that below.
Control Tower topics
| Topic | Description |
|---|---|
| system:alerts | This is a fundamental topic to subscribe to. It is also what is included in the Alert UI shown previously. Whenever an application changes state from running, an alert is generated. |
| system:logs | Again, a fundamental topic of monitoring for errors. There will be some application-related events here. But primarily useful on the sites. |
| system:deployment-events | This will publish events regarding the progress of ongoing deployments. Fine-grained information about what is happening on each site can be fetched from the site using system:scheduler events on each site |
| system:config-events | This contains events about objects being created, updated, and deleted. So for example, if you want to monitor applications being created or modified you can monitor this |
The system:alerts and system:logs (only the highest severity levels) should be integrated to your alerting system. If you want an external system to monitor the progress of deployments this can be achieved by integrating the system:deployment-events. Finally to keep an up to date inventory of your application versions you can inspect the system:config-events.
Site topics
| Topic | Description |
|---|---|
| system:application-metrics | This will be your favorite topic for monitoring your applications. It constantly publishes metrics on your applications resource usage such as memory usage per container. It also collects network statistics for your applications. |
| system:logs | Again, this is a fundamental topic to monitor for errors. It is a mix of application and infrastructure events. You will for example see errors from configured probes here. When trouble shooting application life-cycles drill down here. |
| system:scheduler-events | Detailed information on the progress of the scheduler, such as starting applications. |
| system:container-logs.container-id | All your containers' output on stderr/stdout will be available on this topic. The container logs are kept local to each site but you can query across sites by using the query API. |
The system:application metrics should be integrated to your time series solution for thresholding and anomaly detection. As stated previously select the highest severity levels from system:logs and integrate to your alerting system.
In order to have a detailed overview of the status of ongoing deployments you might want to combine Control Tower deployment events with the scheduler events from each site.
The container logs needs a deep dive elaboration. First of all, Avassa keeps the container logs in Volga at each site. They are not propagated to Control Tower. This for several reasons: traffic load, all content is probably not relevant in the central solutions etc. However note well that Avassa provides a powerful query API that enables you to perform queries from Control Tower across sites and across topics. You can view this as a distributed query engine for your container logs. So there are a number of alternatives how you would like to treat your container logs from a monitoring perspective. It all depends on your use cases and content/format of the logs.
- Perform scheduled distributed queries
- Export the container logs, filtered, enriched, from the edge site to a central solution, for example cloud watch. For this purpose we provide a Fluent Bit plugin which you can run at each site (deployed by Avassa), that will perform the required local processing and thereafter forward to your central log analytics tool
- Ad hoc searches in trouble shooting using the Avassa UI and/or command line
An example how to perform a topic search across sites is shown below: it will search all sites with label city for ERROR in the container logs for a certain container.
supctl do volga query-topics --topics topic-names=system:container-logs.<NAME> filter-re-match=ERROR output-payload-only=true --match-site-labels city
State, drill-down
In order to inspect the application state on a site you can perform the following supctl command. (This is what the User Interface shows in the screen shot above)
supctl show --site gothenburg-bergakungen applications pop
Note well, looking at the application state is often done in combination with inspecting the container logs and system:logs in order to drill down and analyse situations
You can also perform actions to try to fix the issue, for example restart a service:
Or using supctl
supctl do --site amsterdam applications popcorn service-instances popcorn-service-1 restart
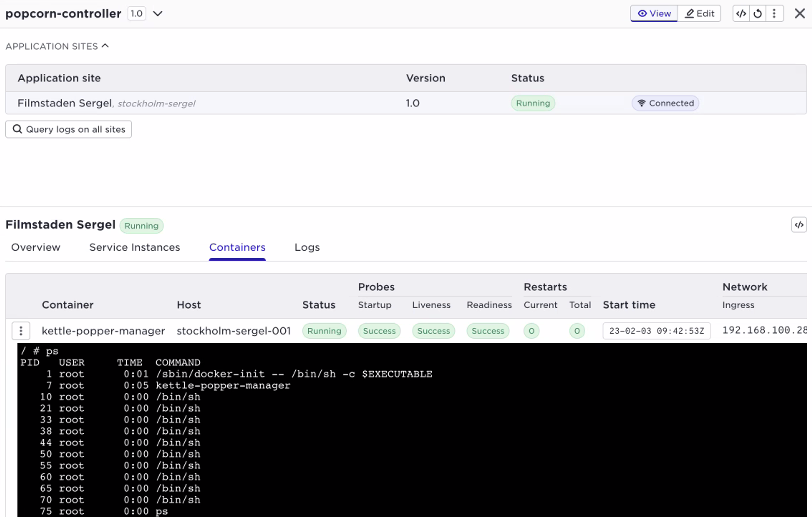
You can also perform exec interactive action to run commands in the container:
supctl do --site amsterdam applications popcorn service-instances popcorn-service-1 containers popcontainer exec-interactive sh
/ # ps
PID   USER     TIME  COMMAND
    1 root      0:03 /sbin/docker-init -- /bin/sh -c $EXECUTABLE
    7 root      0:01 kettle-popper-manager
   24 root      0:00 sh
   30 root      0:00 ps
/ #
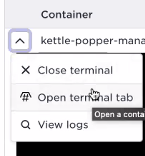
And the same in the User Interface, select the container and use the ... menu
Alarm integration
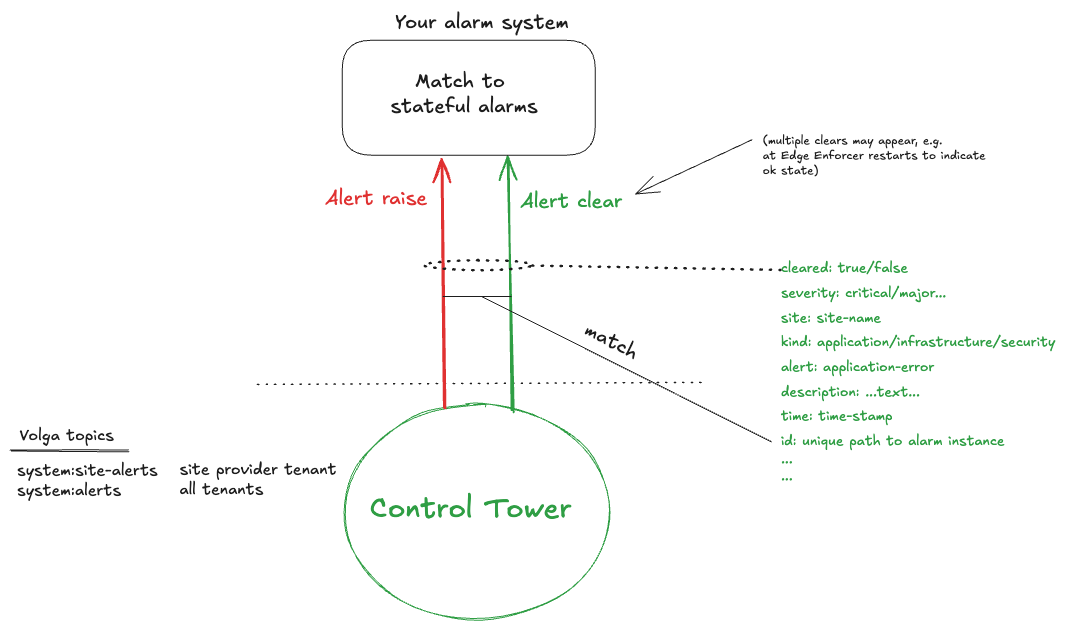
It is recommended to integrate the alert topics to a northbound alarm system where operators manage the lifecycle of the alarms. Generating emails or slack messages directly from the alert topics is not recommended as it will result in a flood of messages.
To do this, it is important to understand the behavior of the Avassa alert notifications. They report state changes of the alarms.
For example, if an application fails on a site, an alert is raised. When the application recovers, a clear alert is sent. If the application fails again, a new alert is raised. However, the Avassa system does not correlate clear and raise, these are shown as individual events in time order. Furthermore, when the Edge Enforcer restarts it sends clear alerts for non-alarming resources. This means that your alarm system must be able to correlate the events into stateful alarms.
Example sequence of events:
- Alarm raised: application X failed on site Y
- Clear alert sent: application X recovered on site Y
- Clear alert sent: application X recovered on site Y
- Clear alert sent: application X recovered on site Y
Based on the above, your alarm system should create an alarm when the first raise alert is received. The alarm should be cleared when the first clear alert is received. The subsequent clear alerts should be ignored.
When matching raise and clear alerts, make sure the id match so a clear on one resource does not clear an alarm on another resource.
The alert payload contains information that can be used for correlation. For example, the following alert indicates that the application robot-controller failed on site madrid. The id field contains the unique identifier of the alert, which can be used to match raise and clear alerts.
expiry-time: 2025-09-05T17:47:31.532Z
cleared: false
severity: critical
site: madrid
kind: application
alert: application-error
description: Application failure.
time: 2025-09-04T17:47:31.532Z
id: application-error/madrid/robot-controller
data:
  application-deployment: robots
  application-version: "1.1"
  error-message: no popcorn-controller-service service instances are ready
  application: robot-controller
cleared: true
severity: critical
site: madrid
kind: application
alert: application-error
time: 2025-09-04T17:48:04.666Z
id: application-error/madrid/robot-controller
data:
  application-deployment: robots
  application-version: "1.1"
  application: robot-controller
Based on the above you should be aware that a simplistic alert notification mapping to individual emails or slack messages will result in a flood of messages. You should use an alarm system that is capable of correlating the events into stateful alarms.
Also note that severity of the alarm is indicated for the clear as well as the raise. Check the cleared field to see if it is a raise or clear alert.
There are two volga topics for alerts: system:alerts and system:site-alerts. The former is accessible for tenants whereas site-alerts is only accessible for the site provider.
For reference we provide an alarm integration example using Prometheus Alertmanager and Grafana in our GitLab repository.
For some alerts it is also complex to implement a 100% clear mechanism. These alerts have a expiry-time field which indicates that you could consider the alert as expired due to the raise triggering condition state is "old". We can not guarantee that a clear alert will always be sent for those.