Using supctl to search and view logs
There are two main operations to view and search volga topics:
- topic consumer (reader) is a way to search a specific topic at a specific site
- query topics is a flexible operation to search in Volga topics at multiple sites
Furthermore, there are three main characteristics of topics that are important to realize:
- Topics are isolated per tenant, so what you see depends on who you are
- Some topics are for the site provider only
- The topic payload might
- reside at the edge sites
- and/or be propagated to control tower.
- originate from control tower
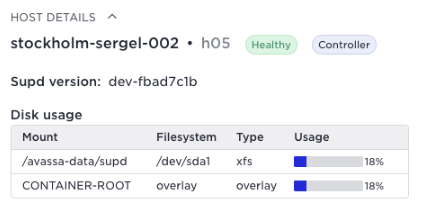
The contents of the topics are stored in the state directory of supd. Disc usage is reported in the host-metrics topic for the /avassa-data/supd volume in /var/lib/supd/state/. The usage of this volume is available as a host metrics topic and in the UI:
All topics are rotating which means that data is lost once the max size is reached. Topics are also replicated amongst controller hosts on a site.
Below follows a summary of topics and where they logically reside, for details read the Topic reference documentation. Note well that this is important since you need to direct your reader or query to the sites or Control Tower depending on what you are looking for. For sizing guidance see the Avassa documentation on sites.
| Topic | Data | Tenant | Site |
|---|---|---|---|
| system:deployment-events | Events on the progress of a deployment such as deployment-inititated, deployment-succeeded | Tenant specific | Control tower only since deployments are orchestrated from control tower. |
| system:scheduler-events | Events regarding scheduling status of applications, services and containers such as service-instance-failed, service-instance-stopped and service-instance-ready | Tenant specific | The edge site since applications are scheduled to run at the edges |
| system:connection-status | Reports if sites are connected or not | Site provider | Control Tower |
| system:application-metrics | Application metrics related to cpu, memory, and network. For example per container percentage used in reference to available memory for the container. Note that these metrics are associated per application, service and container and not the host. For host metrics see separate topic | Tenant specific | The edge site |
| system:audit-trail-log | All authenticated requests for the tenant | Tenant specific | Control Tower has the union of all authenticated requests across sites. The site keeps a local audit trail. |
| system:unauthenticated-audit-trail-log | All unauthenticated requests | Tenant specific | Control Tower |
| system:container-logs:CONTAINER-ID | There is one topic per running | ||
| container. It contains all output from standard output and standard error from | |||
| the container. The CONTAINER-ID is a string on the format | |||
| APPLICATIONNAME.SERVICENAME-IX.CONTAINERNAME , where IX is a numeric index, one | |||
| per service instance (replica). The log content on Volga follows the lifecycle | |||
| of the container. for example, if the service is rescheduled the contents of | |||
| the "previous" log is deleted. If you want to keep logs after the container is | |||
| moved you can enable container log archiving in the [application | |||
| specification](https://avassa-api.redoc.ly/tag/Applications#operation/v1_config_applications_post). | |||
| Tenant specific | The edge site keeps the stderr and stdout from the | ||
| containers running at the edges | |||
| system:logs | This topic contains tenant-specific log info generated by the avassa system. Each log item is on the format <LEVEL\> (TENANT) DATE TIME HOSTNAME SRCFILE PID | Tenant specific | Control tower and edge site |
| system:notifications | This topic contains important notifications from the system. such as container-layer-threshold-reached and ephemeral-volume-threshold-reached | Tenant specific | Control tower |
| system:all-scheduler-events | This topic contains the union of all scheduler related events on the local site for all tenants and are readable only by site providers. The events are the same as for the topic system:scheduler-events. | Site provider | Control tower |
| system:host-metrics | The system samples host metrics related to cpu, memory and disk once every 10 seconds. | Site provider | The edge site |
| system:site-alerts | This topic contains important site-related alerts from the system such as no-space-left-on-disk and host-in-distress | Site provider | Control tower |
Assume you have a site that is called at-home. Below follows a number of supctl commands to inspect meta-data about topics.
See which topics are available
At control-tower
supctl list volga topics
- system:all-scheduler-events
- system:audit-trail-log
- system:connection-status
- system:deployment-events
- system:logs
- system:notifications
- system:site-alerts
- system:unauthenticated-audit-trail-log
At a site
supctl list volga topics --site at-home
- system:all-scheduler-events
- system:application-metrics
- system:audit-trail-log
- system:container-logs:popcorn-controller.popcorn-controller-service-1.kettle-popper-manager
- system:host-metrics
- system:logs
- system:scheduler-events
What should be evident from the above is that since applications are deployed at sites, the site topics refer to applications, scheduling of applications on the site, and the hosts on the site. In the Control Tower you have more global topics like deployments. The audit trail log exists both locally at the site and is also propagated to Control Tower.
You can also inspect a certain topic:
supctl show volga topics system:deployment-events
name: system:deployment-events
tenant: edge
labels: {}
format: json
seqno: 195
chunkno: 1
number-of-chunks: 10
creation-time: 2022-09-13T13:15:59.890Z
assigned-hosts:
  - control-tower-001
leader-host: control-tower-001
worker-hosts: []
requested-replication-factor: 1
current-replication-factor: 1
persistence: disk
size: 976.56 KiB
oldest-entry: 2022-09-13T13:17:39.821Z
dropped-chunks: 0
consumers: []
producers:
  - producer-name: system:deployment-events-control-tower-001
    producing-host: control-tower-001
One especially important field is the number-of-chunks (MB) which tells the size before wrapping. The replication factor tells on how many hosts in the site the topic is replicated.
Or a container topic on the site (more on topic names for your container log later):
supctl show --site gothenburg-bergakungen volga topics system:container-logs:truck-popcorn.popcorn-service-1.popper
name: system:container-logs:truck-popcorn.popcorn-service-1.popper
tenant: edge
labels:
  service-name: popcorn-service
  service-instance: popcorn-service-1
  container-name: popper
  application: truck-popcorn
...
number-of-chunks: 100
Here you see that this container log has the default size of 100 MB.
Topic readers
To illustrate system:deployment-events in control-tower and system:scheduler-events at a site, you can do your first volga consume supctl commands.
Look at deployment status in Control Tower:
supctl do volga topics system:deployment-events consume
This is a first example of a topic consumer. You connect to a topic at the control tower (no site given) and receive the output
{
  "time": "2022-09-14T11:28:55.719Z",
  "seqno": 27,
  "remain": 23,
  "producer-name": "system:deployment-events-control-tower-001",
  "payload": {
    "event": "deployment-initiated",
    "occurred-at": "2022-09-14T11:28:56.705Z",
    "id": "409db774-fd57-4875-a1dc-e05767dc8942",
    "tenant": "edge",
    "data": {
      "application-deployment": "cinemas",
      "application": "theater-room-manager",
      "application-version": "1.1",
      "sites": [
        "stockholm-sture"
      ]
    }
  },
  "mtime": 1663154935719,
  "host": "control-tower-001"
}
{
  "time": "2022-09-14T11:28:56.023Z",
  "seqno": 28,
  "remain": 22,
  "producer-name": "system:deployment-events-control-tower-001",
  "payload": {
    "event": "application-summary-status-changed",
    "occurred-at": "2022-09-14T11:28:57.009Z",
    "id": "df2dda81-88b4-4a06-89be-0e6073cebd18",
    "tenant": "edge",
    "data": {
      "application-deployment": "cinemas",
      "application": "theater-room-manager",
      "application-version": "1.1",
      "sites": [
        "helsingborg-roda-kvarn"
      ],
      "oper-status": "running"
    }
  },
  "mtime": 1663154936023,
  "host": "control-tower-001"
}
{
  "time": "2022-09-14T11:28:56.023Z",
  "seqno": 29,
  "remain": 21,
  "producer-name": "system:deployment-events-control-tower-001",
  "payload": {
    "event": "deployment-succeeded",
    "occurred-at": "2022-09-14T11:28:57.009Z",
    "id": "e9a07a9c-583a-40da-a96e-4d62de993724",
    "tenant": "edge",
    "data": {
      "application-deployment": "cinemas",
      "application": "theater-room-manager",
      "application-version": "1.1",
      "sites": [
        "helsingborg-roda-kvarn"
      ]
    }
  },
  "mtime": 1663154936023,
  "host": "control-tower-001"
}
The above shows that the deployment cinemas for application theater-room-manager was successfully deployed on sites.
Look at application scheduling on a site. In order to direct a command to a site subctl has the parameter - site
supctl do --site helsingborg-roda-kvarn volga topics system:scheduler-events consume
Here you see the application and its services being scheduled on the site as a result of the above deployment
{
  "time": "2022-09-14T11:28:56.524Z",
  "seqno": 31,
  "remain": 19,
  "producer-name": "system:scheduler-events-helsingborg-roda-kvarn-001",
  "payload": {
    "event": "service-instance-ready",
    "occurred-at": "2022-09-14T11:28:56.986Z",
    "id": "fb7f7da7-9f64-491b-a524-7eb9e0df6db5",
    "tenant": "edge",
    "data": {
      "application": "theater-room-manager",
      "application-version": "1.1",
      "service-name": "theater-operations",
      "service-instance": "theater-operations-1",
      "site": "helsingborg-roda-kvarn",
      "hostname": "helsingborg-roda-kvarn-001",
      "application-ips": [
        "172.19.0.2"
      ]
    }
  },
  "mtime": 1663154936524,
  "host": "helsingborg-roda-kvarn-001"
}
{
  "time": "2022-09-14T11:28:56.543Z",
  "seqno": 32,
  "remain": 18,
  "producer-name": "system:scheduler-events-helsingborg-roda-kvarn-001",
  "payload": {
    "event": "application-status-changed",
    "occurred-at": "2022-09-14T11:28:57.005Z",
    "id": "4def664b-b0ce-4af7-8c10-c7aff71bc9cf",
    "tenant": "edge",
    "data": {
      "application": "theater-room-manager",
      "oper-status": "running",
      "application-version": "1.1",
      "application-deployment": "cinemas",
      "site": "helsingborg-roda-kvarn"
    }
  },
  "mtime": 1663154936543,
  "host": "helsingborg-roda-kvarn-001"
}
Ok, lets continue by inspecting application metrics at a site:
supctl do --site at-home volga topics system:application-metrics consume
{
        "time": "2022-10-03T23:14:42.711Z",
        "host": "at-home-001",
        "application": "popcorn-controller",
        "per-container": {
          "service-instance": "popcorn-controller-service-1",
          "container": "kettle-popper-manager",
          "memory": {
            "used": 1900544,
            "total": 1016963072,
            "percentage-used": 1
          },
          "cpu": {
            "nanoseconds": 65008455824,
            "cpus": 1.0,
            "shares": 1024
          },
          "container-layer": {
            "size": 4903276,
            "used": 3517440,
            "free": 1369452,
            "percentage-used": 72
          }
        }
      }
Next step is to constantly listen to what is published on the topic by using the follow flag:
supctl do --site at-home volga topics system:application-metrics consume --follow
Fine-tuning even more, in many cases you are just interested in the payload without meta-data using the payload-only flag:
supctl do --site at-home volga topics system:application-metrics consume --payload-only
These metrics are published every 30 second so you might want to narrow your search to the last minute:
supctl do --site at-home volga topics system:application-metrics consume --payload-only --position-since 1m
You can also select messages that matches a regexp (Perl RE) pattern:
supctl do --site at-home volga topics system:application-metrics consume --payload-only --re-match popcorn-controller-service-1 --position-since 1m
supctl do --site at-home volga topics system:application-metrics consume --payload-only --fields "entries/[host,application,per-application]"
The last piece we will mention in this introduction to topic consumer is that you can select/slice fields from the output. Think of the output as a tree structure and navigate to a field x/y/z.
{
  "tenant": "edge",
  "entries": [
    {
      "time": "2022-10-04T02:15:22.555Z",
      "host": "at-home-001",
      "application": "popcorn-controller",
      "per-application": {
        "hosts": [
          {
            "host": "at-home-001",
            "memory-percentage-used": 1,
            "disk-percentage-used": 73
Lets assume we are interested in disc-usage. A first attempt could look like:
supctl do --site at-home volga topics system:application-metrics consume --payload-only --re-match popcorn-controller-service-1 --position-since 1m --fields entries/per-application/hosts/disk-percentage-used
But you are lacking context in the output
{
      "per-application": {
        "hosts": [
          {
            "disk-percentage-used": 73
          }
        ]
      }
    },
You would certainly like to see the host as well. For that purpose you can add a comma-separated set of paths. You need to quote the expression. --fields "entries/per-application/hosts/[host,disk-percentage-used]"
supctl do --site at-home volga topics system:application-metrics consume --payload-only --re-match popcorn-controller-service-1 --position-since 1m --fields "entries/per-application/hosts/[host,disk-percentage-used]"
Which results in:
"host": "at-home-001",
"disk-percentage-used": 73
Examples consuming other topics
Audit trail: search for a specific user (Joe Anderson in this example) performing an operation and at what time:
supctl do --site at-home volga topics system:audit-trail-log consume --fields "payload/[occurred-at,path,method]" --re-match Anderson
{
  "payload": {
    "path": "/v1/state/volga/topics/system%3Aaudit-trail-log/consume",
    "occurred-at": "2022-10-04T02:37:48.206Z",
    "method": "POST"
  }
}
{
  "payload": {
    "path": "/v1/state/volga/topics/system%3Aaudit-trail-log/consume",
    "occurred-at": "2022-10-04T02:37:56.183Z",
    "method": "POST"
  }
}
{
  "payload": {
    "path": "/v1/state/volga/topics/system%3Aaudit-trail-log/consume",
    "occurred-at": "2022-10-04T02:40:38.961Z",
    "method": "POST"
  }
}
I did the above request directly to the site but as stated before the Edge Enforcer propagates all authentication logs to Control Tower as well so in case of theft for example you have the history. Try remove the - site on the above command and see that you get the same thing.
There are certain operations that do not require authentication such as list OIDC providers. These are available in the unauthenticated-audit-trail-log.
To look at all unauthenticated strongbox operations you could do:
supctl do volga topics system:unauthenticated-audit-trail-log consume --re-match strongbox/authentication
Lets continue with logs. There is a general system log at each site which tells you about what is going on. Imagine you are interested in all image pulls:
supctl do --site helsingborg-roda-kvarn volga topics system:logs consume --re-match pull
{
  "time": "2022-10-07T11:45:23.569Z",
  "seqno": 44,
  "remain": 14,
  "producer-name": "system:logs",
  "payload": "<INFO>    2022-10-07 11:45:24.170297Z helsingborg-roda-kvarn-001: Initiating pull of parent:4848/edge/avassa-public/movie-theaters-demo/kettle-popper-manager@sha256:dea0f9414a4387567f5d for application poppos\n",
  "mtime": 1665143123569,
  "host": "helsingborg-roda-kvarn-001"
}
{
  "time": "2022-10-07T11:45:24.852Z",
  "seqno": 45,
  "remain": 13,
  "producer-name": "system:logs",
  "payload": "<INFO>    2022-10-07 11:45:25.452482Z helsingborg-roda-kvarn-001: Successful pull of parent:4848/edge/avassa-public/movie-theaters-demo/kettle-popper-manager@sha256:dea0f9414a4387567f5d\n",
  "mtime": 1665143124852,
  "host": "helsingborg-roda-kvarn-001"
}
Moving from not so critical logs to things you should monitor system:site-alerts (site provider only) and system:notifications (tenant specific).
supctl do volga topics system:notifications consume
supctl do volga topics system:site-alerts consume
I had a sunny day on no red alerts. Things that will show up here are for example:
system:notifications
container-layer-threshold-reached: alert signaling that a container-layer reached an alerting thresholdephemeral-volume-threshold-reached: alert signaling that a ephemeral volume reached an alerting threshold.
system:site-alerts
disk-threshold-reached: alert signaling that a disk reached an alerting thresholdhost-in-disaster-mode: alert signaling that a host ended up in disaster mode, the site is impactedhost-in-distress: alert signaling that a host ended up in distress
The above alerts are related to the host metrics Avassa are collecting. You collect these and set your own thresholds and pass into any general metrics monitoring system:
supctl do --site at-home volga topics system:host-metrics consume
{
  "time": "2022-10-04T04:29:13.999Z",
  "seqno": 64119,
  "remain": 20,
  "producer-name": "host-metrics",
  "payload": {
    "time": "2022-10-04T04:29:14.855Z",
    "site": "at-home",
    "cluster-hostname": "at-home-001",
    "hostname": "foo",
    "cpu": {
      "vcpus": 1
    },
    "memory": {
      "total": 1016963072,
      "free": 106381312,
      "available": 547713024
    },
    "loadavg": {
      "avg1": 0.49,
      "avg5": 0.42,
      "avg15": 0.44,
      "running": 2,
      "total": 246
    },
    "disk": [
      {
        "filesystem": "/dev/sda1",
        "type": "ext4",
        "size": 4903276,
        "used": 3521124,
        "free": 1365768,
        "percentage-used": 73,
        "mount": "/avassa-data/supd"
      },
      {
        "filesystem": "overlay",
        "type": "overlay",
        "size": 4903276,
        "used": 3521124,
        "free": 1365768,
        "percentage-used": 73,
        "mount": "CONTAINER-ROOT"
      }
    ]
  },
  "mtime": 1664857753999,
  "host": "at-home-001"
}
Average load metrics are taken from /proc/loadavg. Metrics avg1, avg5 and avg15 reflects the average load of processes:
- queued for execution
- executed
- sleeping while being uninterruptible, typically waiting for I/O over time period 1, 5 and 15 minutes respectively.
The disk metrics are for the volumes that are relevant for the Edge Enforcer and edge container applications, not for volumes outside the scope of the Edge Enforcer. The CONTAINER-ROOT mount is the space used by the supd container and /avassa-data/supd is the volume where supd stores state, for example volga data. If the site provider has prepared volumes for application owners ephemeral/persistent volumes, these will show up as separate disk metrics.
The last topic we will look at is maybe the one you have been waiting for....your container logs. On each site Volga picks up what the container writes on stdout and stderr. This is stored on the site and not propagated to Control Tower. Instead you can use the topic reader to perform queries across sites. More on that later.
First a reminder on the application structure:
-
Application
-
Service
- Container
-
Assume you have an application popcorn-controller with a service popcorn-service. Finally the service embeds a kettle-popper-manager container. Then you have specified a number of replicas for your services, say 2. Then you will have these instances:
popcorn-controller:popcorn-service-1:kettle-popper-manager
popcorn-controller:popcorn-service-2:kettle-popper-manager
This corresponds exactly to available topics at the site where the application is running. You can therefore inspect the container logs using the topic system:container-logs:popcorn-controller:popcorn-service-1:kettle-popper-manager and system:container-logs:popcorn-controller:popcorn-service-2:kettle-popper-manager
supctl do --site at-home volga topics system:container-logs:popcorn-controller.popcorn-controller-service-1.kettle-popper-manager consume
{
  "time": "2022-10-04T09:07:00.339Z",
  "seqno": 51906,
  "remain": 19,
  "producer-name": "system:container-logs:popcorn-controller.popcorn-controller-service-1.kettle-popper-manager-at-home-001",
  "payload": "\u001B[2m2022-10-07T17:29:52.400814Z\u001B[0m \u001B[32m INFO\u001B[0m \u001B[2mkettle_popper_manager\u001B[0m\u001B[2m:\u001B[0m 13676996 popcorns popped\n",
  "mtime": 1664874420339,
  "host": "at-home-001"
}
{
  "time": "2022-10-04T09:07:15.458Z",
  "seqno": 51907,
  "remain": 18,
  "producer-name": "system:container-logs:popcorn-controller.popcorn-controller-service-1.kettle-popper-manager-at-home-001",
  "payload": "\u001B[2m2022-10-07T17:30:07.375367Z\u001B[0m \u001B[32m INFO\u001B[0m \u001B[2mkettle_popper_manager\u001B[0m\u001B[2m:\u001B[0m 13677496 popcorns popped\n",
  "mtime": 1664874435458,
  "host": "at-home-001"
}
That was all for an introduction to topic readers. Read more:
Topic queries
In the previous section you learned how to consume from a specific topic, most often from a specific site. But if you would like to search multiple topics across multiple sites? Meet topic queries. Topic queries are always directed towards Control Tower which in turn manages the search across sites.
You can modify the search by choosing:
- which sites to run the query on
- which topics to run the query towards
- what to search for
- how the output result should be presented
Before giving some examples of topic queries, we need to talk a bit on how sites are handled. For topic readers in the previous section the behaviour was
- no site given: the topic consumer reads only data from Control Tower
- you could specify one site using - site
For topic queries the behaviour is:
- no site given: all sites including Control Tower is searched
- in order to search just Control Tower you have to specify the site "control-tower"
- you can specify any number of sites by enumeration, regexp on names, matching labels and more.
So the topic consumer
supctl do volga topics system:deployment-events consume
Is equivalent to the following topic query
supctl do volga query-topics --topics topic-names=system:deployment-events --site-names control-tower
Let us do the first query across all sites. Remember the system:logs topic? It contained notifications with different severities. Lets see if we have some errors across all sites:
supctl do volga query-topics --topics topic-names=system:logs filter-re-match=ERROR output-payload-only=true
at-home-001 : <ERROR>   2022-09-19 09:27:54.495092Z at-home-001: Could not schedule edge.popcorn-controller.popcorn-controller-service-3 to any host
...
at-home-001 : <ERROR>   2022-09-19 09:29:12.178106Z at-home-001: Probe "live" failed for container popcorn-controller.popcorn-controller-service-1.kettle-popper-manager: HTTP GET failed with reason: timeout
...
control-tower-001 : <ERROR>   2022-10-07 09:17:05.470799Z control-tower-001: Failed to pull egistry.gitlab.com/avassa-public/movie-theaters-demo/kettle-popper-manager:latest: connect to registry failed: non-existing domain
As you see you get output from edge sites as well as from control tower.
Let us also filter on certain sites based on site labels, in this case we have labelled sites with city=cityname, and you can match on the label key as shown below to search in all cities.
supctl do volga query-topics --topics topic-names=system:logs filter-re-match=ERROR output-payload-only=true --match-site-labels city
You might also want to search sites according to a specific deployment. In the example below we are searching scheduler events on all sites matching the deployment popcorn-deployment:
supctl do volga query-topics --topics topic-names=system:scheduler-events output-payload-only=true --sites-from-application-deployment popcorn-deployment
Which results in:
...
{
  "tenant": "edge",
  "occurred-at": "2022-10-08T11:41:17.252Z",
  "id": "0284dec7-f497-498b-94fc-cc680eb1a5bf",
  "event": "service-instance-ready",
  "data": {
    "site": "gothenburg-bergakungen",
    "service-name": "popper",
    "service-instance": "popper-1",
    "hostname": "gothenburg-bergakungen-001",
    "application-ips": [
      "172.19.0.1"
    ],
    "application": "popcorn-application"
  }
}
{
  "tenant": "edge",
  "occurred-at": "2022-10-08T11:41:17.255Z",
  "id": "efd67e94-dcfd-4679-9d24-5d26a7feef30",
  "event": "application-status-changed",
  "data": {
    "site": "gothenburg-bergakungen",
    "oper-status": "running",
    "application-deployment": "popcorn-deployment",
    "application": "popcorn-application"
  }
}
...
In the same way as a topic reader you can pass the option - follow to constantly listen to events. This could be relevant in the example above if you want to see the site progress of a certain deployement:
supctl do volga query-topics --topics topic-names=system:scheduler-events output-payload-only=true --sites-from-application-deployment popcorn-deployment - follow
In many cases you want to filter according to time. You have to options:
- since: back in time until now (option
- since) - a specific time using from - to (options
- start-timeand- stop-time)
Let us build on the above example and add a time window starting with since:
supctl do volga query-topics --topics topic-names=system:scheduler-events output-payload-only=true --sites-from-application-deployment popcorn-deployment --follow --since 10m
A specific time frame including stop time can look like the below. Note that in this case you will have to remove the follow option since you have a stop time:
supctl do volga query-topics --topics topic-names=system:scheduler-events output-payload-only=true --sites-from-application-deployment popcorn-deployment --start-time 2022-10-06T00:00:00.000Z --stop-time 2022-10-08T12:00:00.000Z
Hint: If you find it hard to write the time format you can use the start and stop time picker in the UI and see the query. Go to an application and select a site, thereafter logs:
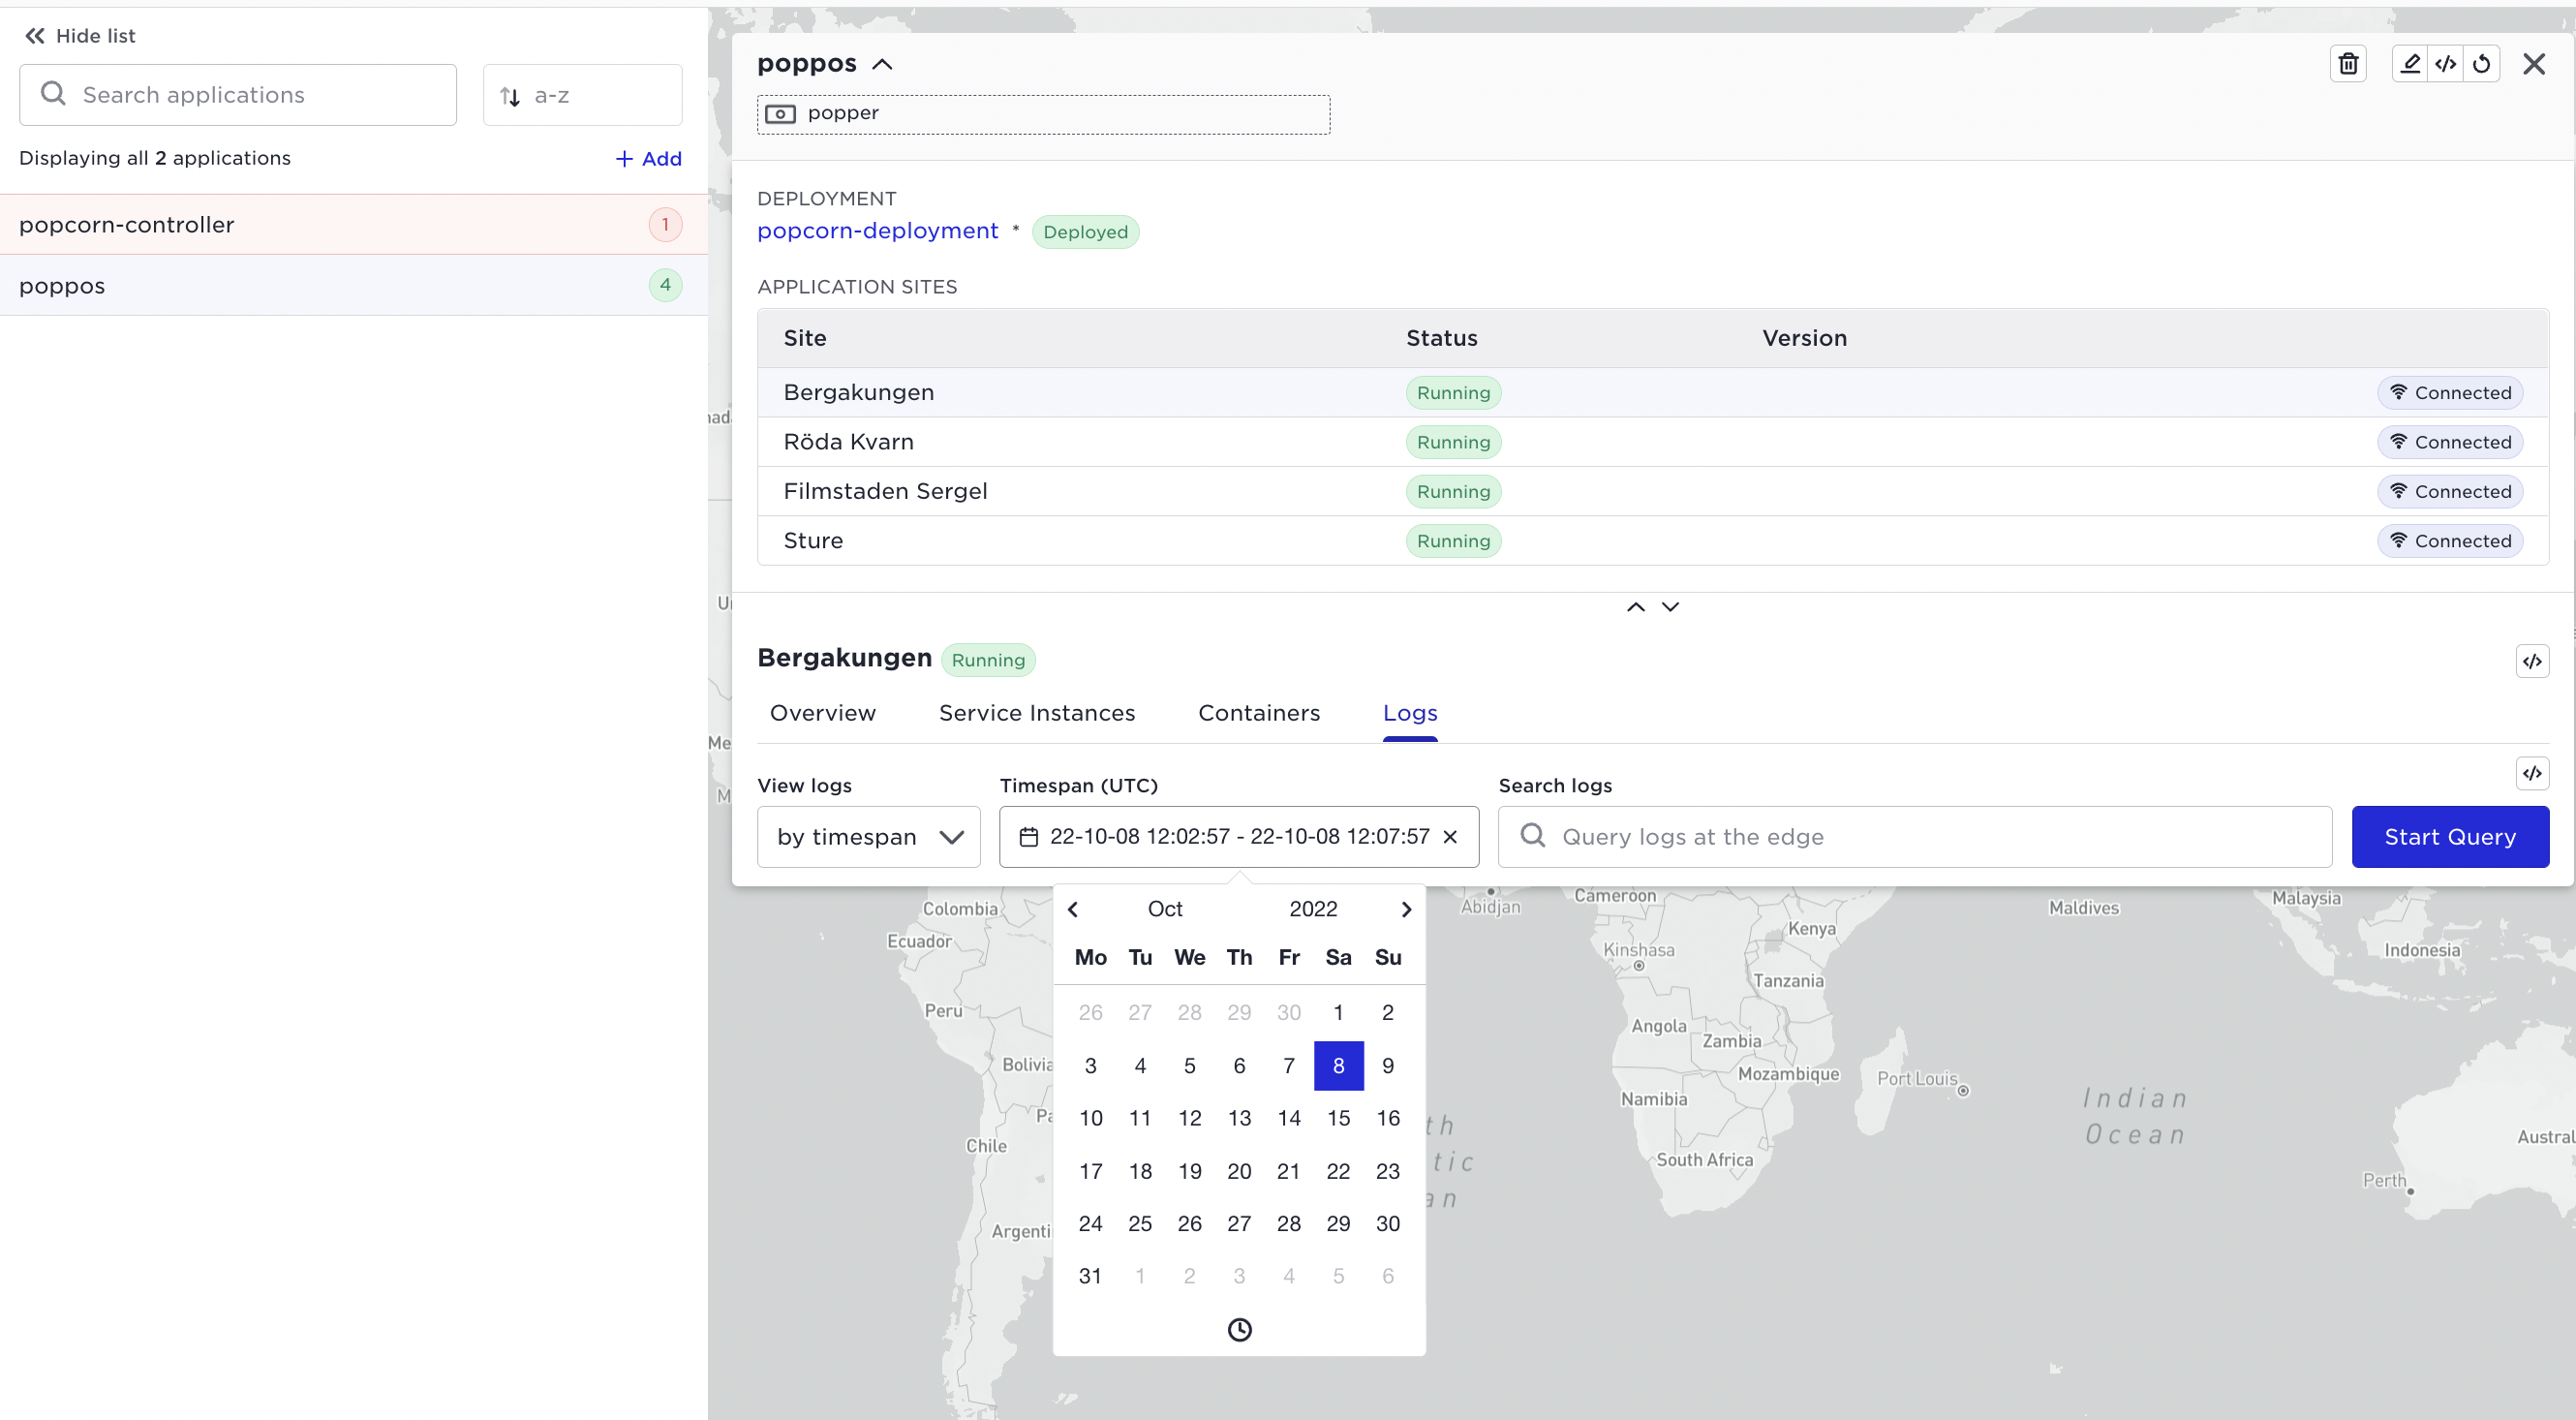
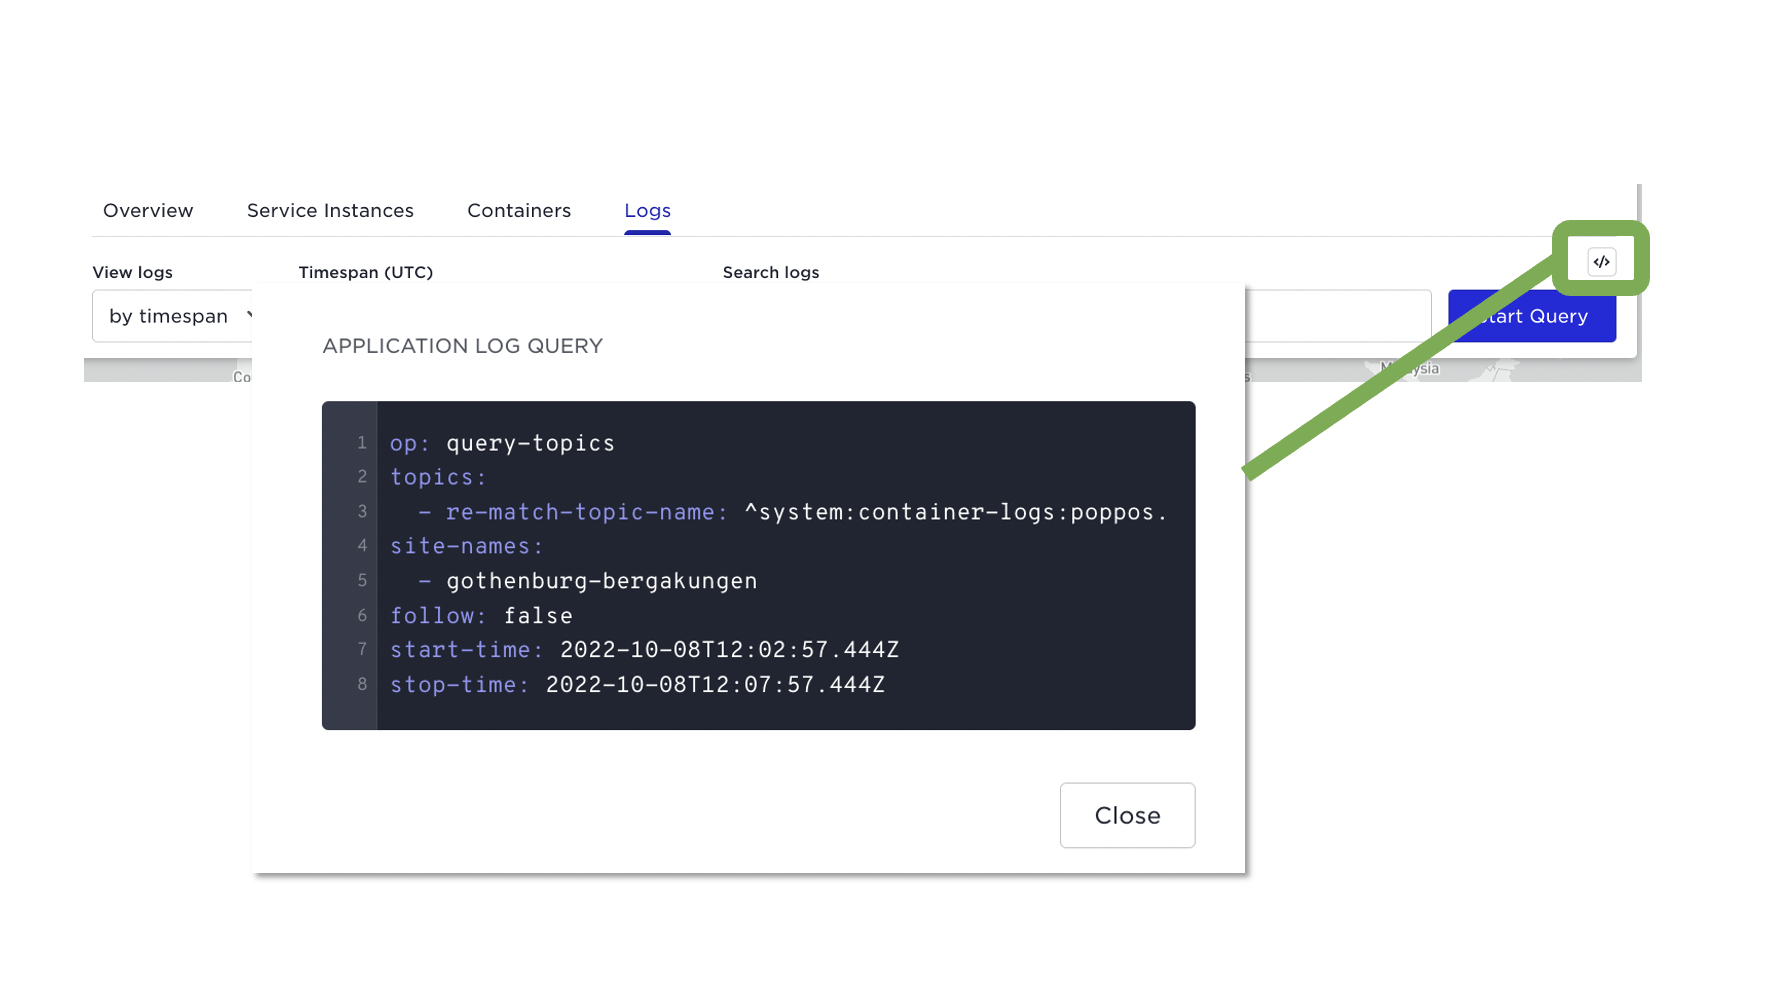
Pick your date and time and thereafter inspect the query:
Ok, back to some other useful options. When you search logs across sites and the matching data from all sites are merged into the output it can sometimes be hard to see from where each line originates. There is an option to format the output:
- %h The host that produced the message
- %s The site that produced the message
- %p The payload of the message
- %t The time when the log entry was originally produced
So we will now append a format option "output-format="%s : %h : %t : %p" to our original
supctl do volga query-topics --topics topic-names=system:logs filter-re-match=ERROR output-payload-only=true output-format="%s : %h : %t : %p"
at-home : at-home-001 : 2022-09-17T02:27:15.120+00:00 : <ERROR>   2022-09-19 09:29:12.174222Z at-home-001: Probe "ready" failed for container popcorn-controller.popcorn-controller-service-1.kettle-popper-manager: HTTP GET failed with reason: timeout
...
control-tower : control-tower-001 : 2022-10-07T09:22:04.741+00:00 : <ERROR>   2022-10-07 09:22:05.597704Z control-tower-001: Failed to pull egistry.gitlab.com/avassa-public/movie-theaters-demo/kettle-popper-manager:latest: connect to registry failed: non-existing domain
...
stockholm-sture : stockholm-sture-001 : 2022-09-13T18:37:15.047+00:00 : <ERROR>  2022-09-13 18:37:16.019467Z stockholm-sture-001: FORMAT ERROR: "Failed to establish reconnected producer to topic ~s: ~s"
It is also possible to search different topics across the sites:
supctl do volga query-topics --topics topic-names=system:logs,system:site-alerts
When you are starting to build these kinds of queries it is sometimes helpful to use the - dryrun option to see how the query will executed. You will see which topics exist on which sites and which sites are not responding:
supctl do volga query-topics --topics topic-names=system:logs,system:site-alerts - dry-run
{
  "specified-sites": [
    "silent-site",
    "stockholm-sture",
    "stockholm-sergel",
    "helsingborg-roda-kvarn",
    "gothenburg-bergakungen",
    "control-tower",
    "at-home",
    "far-away-site"
  ],
  "site-reports": [
    {
      "site": "at-home",
      "topics": [
        "system:logs"
      ]
    },
    {
      "site": "stockholm-sergel",
      "topics": [
        "system:logs"
      ]
    },
    {
      "site": "helsingborg-roda-kvarn",
      "topics": [
        "system:logs"
      ]
    },
    {
      "site": "control-tower",
      "topics": [
        "system:site-alerts",
        "system:logs"
      ]
    },
    {
      "site": "stockholm-sture",
      "topics": [
        "system:logs"
      ]
    },
    {
      "site": "gothenburg-bergakungen",
      "topics": [
        "system:logs"
      ]
    }
  ],
  "non-responding-sites": [
    "silent-site",
    "far-away-site"
  ]
}
There is an even more powerful way to search different topics, the topics can be a list with different filters and output per topic as shown below. It also introduces the concept of using regexp re-match-topic-name to match several topic names.
supctl do volga query-topics --topics re-match-topic-name=container-logs --topics topic-names=system:audit-trail-log filter-drop-until-last-re-match=supctl output-fields=payload/user --since 1m
Another common use of the re-match-topic-name is to search the container logs within a service. Remember that service replicas will result in the following example topics:
popcorn-controller:popcorn-service-1:kettle-popper-manager
popcorn-controller:popcorn-service-2:kettle-popper-manager
To perform a query of these container logs you could do:
supctl do volga query-topics --topics re-match-topic-name=^system:container-logs.truck-popcorn.popcorn-service output-fields=host,payload --follow
The above also illustrates the volga queries have the same support for selecting fields as topic readers.
{
  "host": "stockholm-sergel-001",
  "payload": "\u001B[2m2022-10-11T13:22:32.184349Z\u001B[0m \u001B[32m INFO\u001B[0m \u001B[2mkettle_popper_manager\u001B[0m\u001B[2m:\u001B[0m 671326 popcorns popped\n"
}
{
  "host": "gothenburg-bergakungen-001",
  "payload": "\u001B[2m2022-10-11T13:22:32.196373Z\u001B[0m \u001B[32m INFO\u001B[0m \u001B[2mkettle_popper_manager\u001B[0m\u001B[2m:\u001B[0m 671641 popcorns popped\n"
}
{
  "host": "helsingborg-roda-kvarn-001",
  "payload": "\u001B[2m2022-10-11T13:22:32.421711Z\u001B[0m \u001B[32m INFO\u001B[0m \u001B[2mkettle_popper_manager\u001B[0m\u001B[2m:\u001B[0m 671493 popcorns popped\n"
}
You can learn more on the query API in the reference documentation.
Creating your own topics
Sofar we have worked with the topics created by the Avassa system. You can also create your own topics. This can for example be very useful for your applications in order to have a edge native communication bus.
In the example below we will create a topic on one of the sites.
supctl do --site gothenburg-bergakungen volga create-topic myown-topic string
supctl do --site gothenburg-bergakungen volga topics myown-topic produce foobar
supctl do --site gothenburg-bergakungen volga topics myown-topic consume

supctl do --site gothenburg-bergakungen volga topics myown-topic consume
{
  "time": "2022-12-06T13:12:31.771Z",
  "seqno": 1,
  "remain": 24,
  "producer-name": "REST-api",
  "payload": "foobar",
  "mtime": 1670332351771,
  "host": "gothenburg-bergakungen-001"
}
{
  "time": "2022-12-06T13:12:46.526Z",
  "seqno": 2,
  "remain": 23,
  "producer-name": "REST-api",
  "payload": "foobar2",
  "mtime": 1670332366526,
  "host": "gothenburg-bergakungen-001"
}
You can inspect the meta-data for your newly created topic:
supctl show --site gothenburg-bergakungen volga topics myown-topic

name: myown-topic
tenant: edge
labels: {}
format: string
seqno: 2
chunkno: 1
number-of-chunks: 100
creation-time: 2022-12-06T13:12:06.245Z
assigned-hosts:
  - gothenburg-bergakungen-001
leader-host: gothenburg-bergakungen-001
worker-hosts: []
requested-replication-factor: 1
current-replication-factor: 1
persistence: disk
size: 255 B
entries: 2
oldest-entry: 2022-12-06T13:12:31.771Z
last-entry: 2022-12-06T13:12:46.526Z
dropped-chunks: 0
consumers: []
producers: []